# Access denied while opening Stack-Monitoring on Kibana 7.8
**URL:** https://discuss.elastic.co/t/access-denied-while-opening-stack-monitoring-on-kibana-7-8/239947
**Category:** Kibana
**Tags:** elastic-stack-monitoring, elastic-stack-security
**Created:** [July 6, 2020, 3:12am UTC](https://discuss.elastic.co/t/access-denied-while-opening-stack-monitoring-on-kibana-7-8/239947 "2020-07-06T03:12:21Z")
**Posts on this page:** 9
**Page:** 1
### Author:  [@vishakh](https://discuss.elastic.co/u/vishakh)
#### Post date: [July 6, 2020, 3:12am UTC](https://discuss.elastic.co/t/access-denied-while-opening-stack-monitoring-on-kibana-7-8/239947/1 "2020-07-06T03:12:22Z")
Stack Intro: I'm running ELK-Stack 7.8 with 3 Cluster-Nodes
Enabled XPack security in elasticsearch yml "xpack.security.enabled: true" and also enabled SSL/TLS on Transport and HTTP with below conf:
xpack.security.transport.ssl.enabled: true
xpack.security.transport.ssl.verification\_mode: certificate
xpack.security.transport.ssl.key: /etc/elasticsearch/certs/wildcard.key
xpack.security.transport.ssl.certificate: /etc/elasticsearch/certs/wildcard.crt
xpack.security.transport.ssl.certificate\_authorities: ["/etc/elasticsearch/certs/ca.crt"]
xpack.security.http.ssl.enabled: true
xpack.security.http.ssl.key: /etc/elasticsearch/certs/wildcard.key
xpack.security.http.ssl.certificate: /etc/elasticsearch/certs/wildcard.crt
xpack.security.http.ssl.certificate\_authorities: ["/etc/elasticsearch/certs/ca.crt"]
Then finally used "bin/elasticsearch-setup-passwords auto" to generate credentials for built-in users.
Configured the credentials in kibana.yml with elasticsearch.username: elastic and related password.
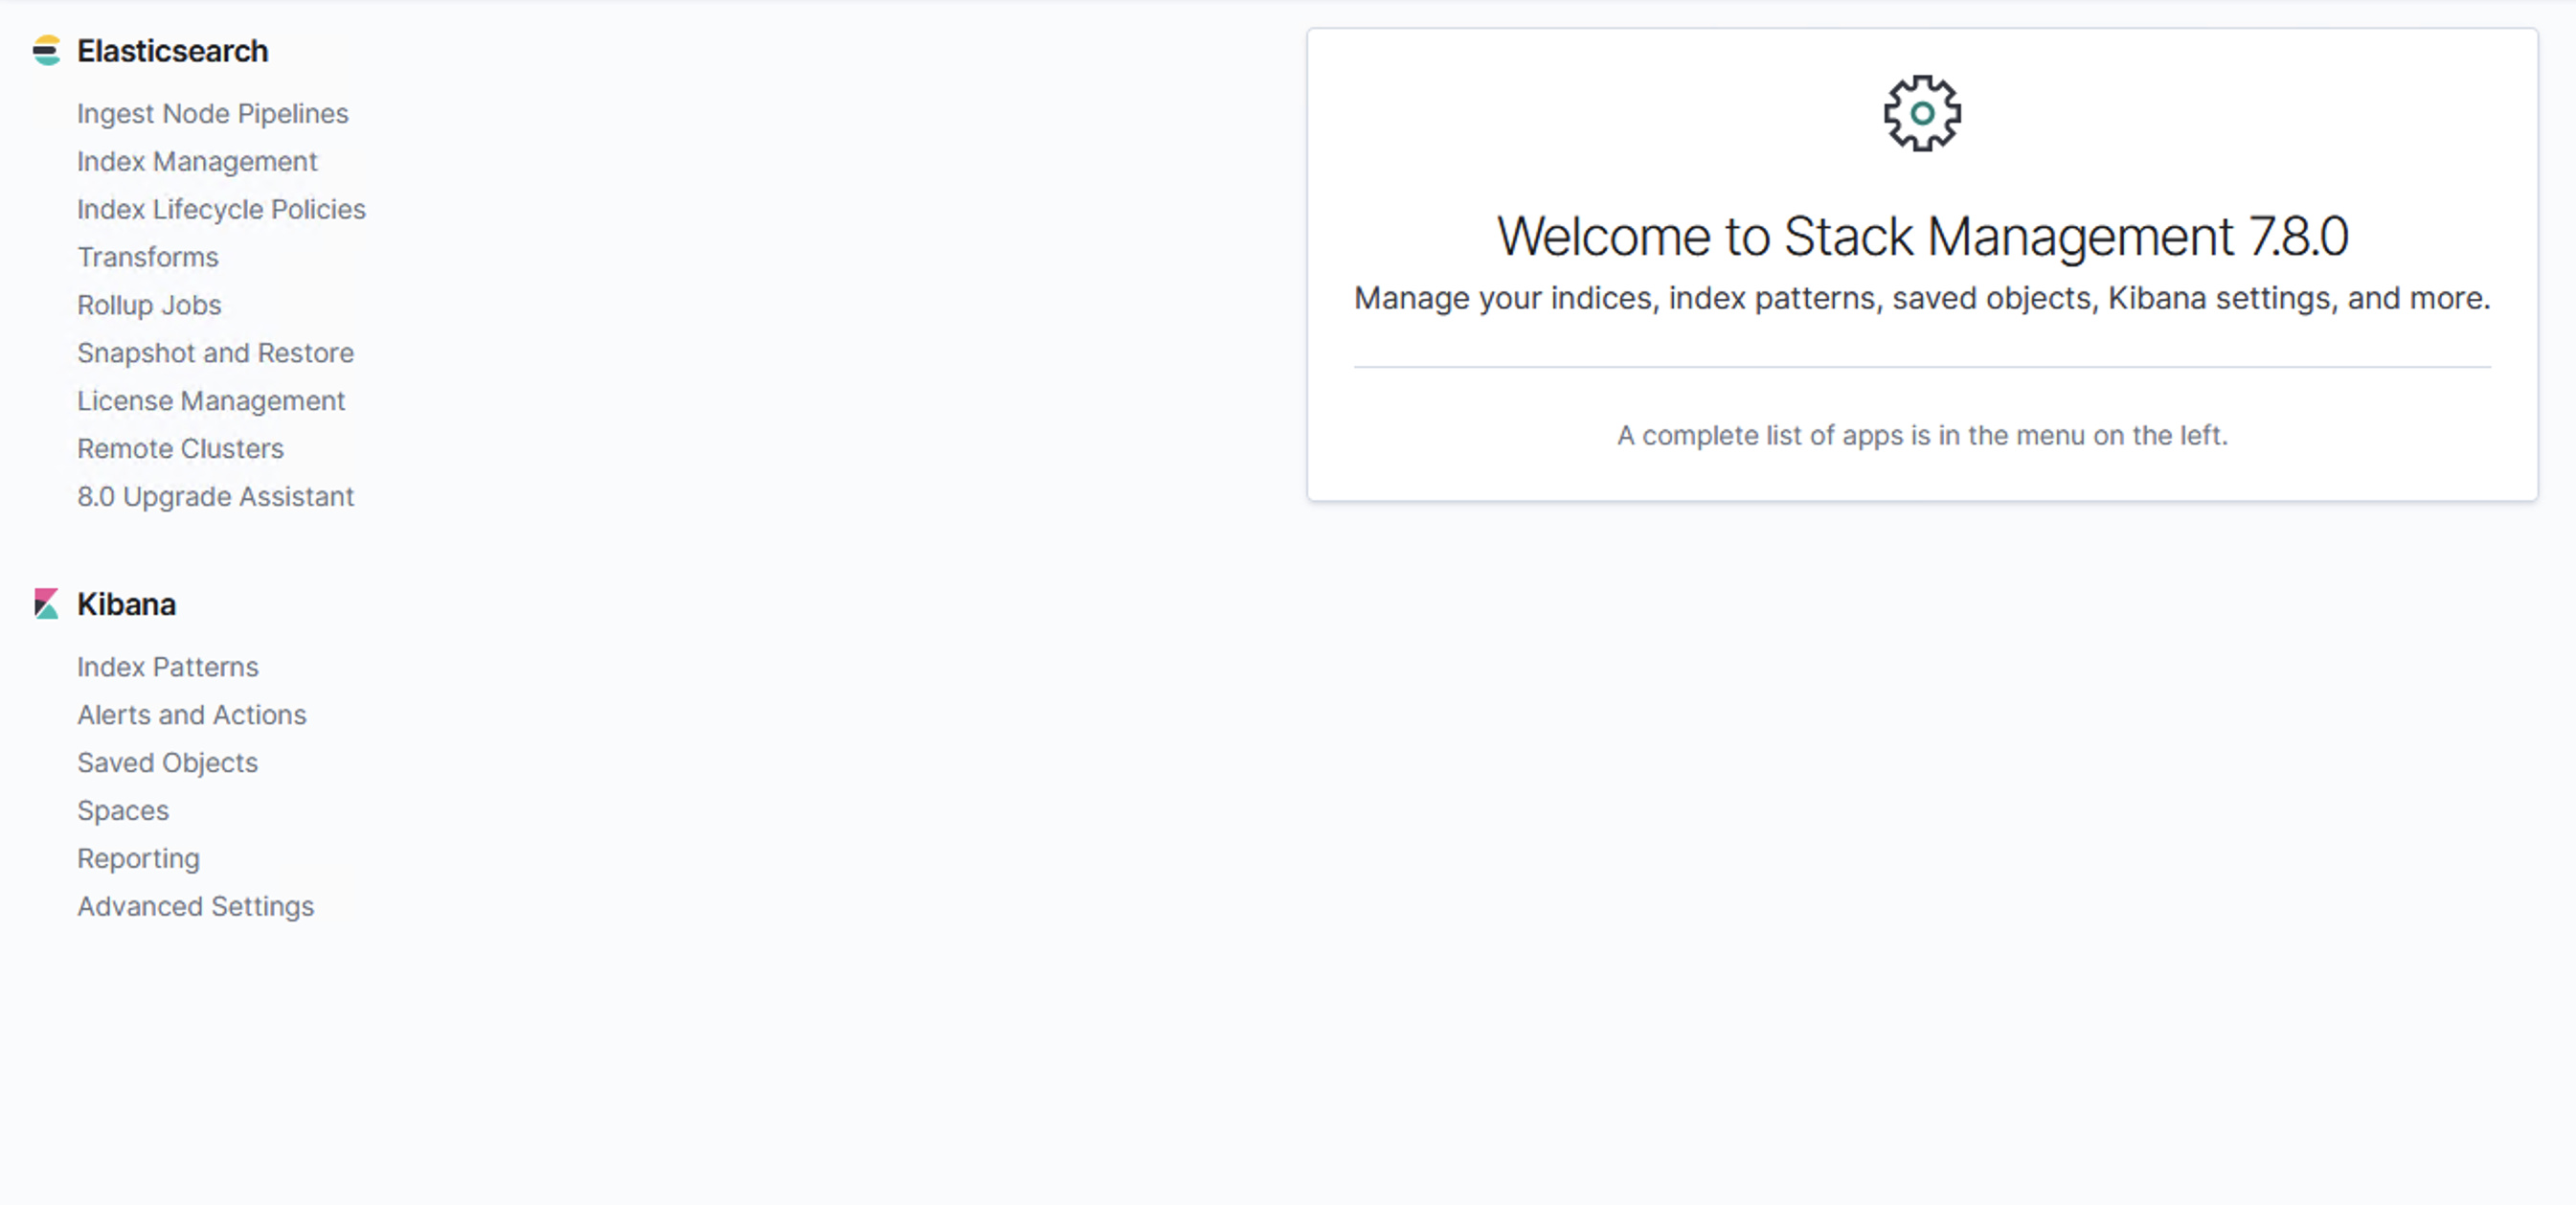
After all these configurations, I was able to login to Kibana dashboard using built-in user 'elastic' but **ISSUE** : I'm unable to view security options and getting access denied while accessing stack-monitoring with attached screenshot references
---
### Author:  [@chrisronline](https://discuss.elastic.co/u/chrisronline)
#### Post date: [July 6, 2020, 1:07pm UTC](https://discuss.elastic.co/t/access-denied-while-opening-stack-monitoring-on-kibana-7-8/239947/2 "2020-07-06T13:07:54Z")
Can you share your entire kibana.yml? I'm assuming you are not using a dedicated monitoring cluster (and instead using a single cluster to store your "production" data as well as the monitoring data"), is that correct?
---
### Author:  [@vishakh](https://discuss.elastic.co/u/vishakh)
#### Post date: [July 6, 2020, 2:02pm UTC](https://discuss.elastic.co/t/access-denied-while-opening-stack-monitoring-on-kibana-7-8/239947/3 "2020-07-06T14:02:48Z")
```auto
server.port: 5601
server.host: "localhost"
#server.basePath: ""
#server.rewriteBasePath: false
#server.maxPayloadBytes: 1048576
server.name: ""
xpack.encryptedSavedObjects.encryptionKey: ""
elasticsearch.hosts: ["http://:9200"]
#elasticsearch.preserveHost: true
#kibana.index: ".kibana"
#kibana.defaultAppId: "home"
# If your Elasticsearch is protected with basic authentication, these settings provide
# the username and password that the Kibana server uses to perform maintenance on the Kibana
# index at startup. Your Kibana users still need to authenticate with Elasticsearch, which
# is proxied through the Kibana server.
elasticsearch.username: "elastic"
elasticsearch.password: ""
# Enables SSL and paths to the PEM-format SSL certificate and SSL key files, respectively.
# These settings enable SSL for outgoing requests from the Kibana server to the browser.
server.ssl.enabled: false
# server.ssl.certificate: /etc/kibana/certs/wildcard.crt
# server.ssl.key: /etc/kibana/certs/wildcard.key
elasticsearch.ssl.certificate: /etc/kibana/certs/wildcard.crt
elasticsearch.ssl.key: /etc/kibana/certs/wildcard.key
elasticsearch.ssl.certificateAuthorities: ["/etc/kibana/certs/ca.crt"]
#elasticsearch.ssl.verificationMode: full
#elasticsearch.pingTimeout: 1500
#elasticsearch.requestTimeout: 30000
#elasticsearch.requestHeadersWhitelist: [authorization]
#elasticsearch.customHeaders: {}
#elasticsearch.shardTimeout: 30000
#elasticsearch.startupTimeout: 5000
#elasticsearch.logQueries: false
#pid.file: /var/run/kibana.pid
#logging.dest: stdout
#logging.silent: false
#logging.quiet: false
#logging.verbose: false
#ops.interval: 5000
#i18n.locale: "en"
```
---
### Author:  [@vishakh](https://discuss.elastic.co/u/vishakh)
#### Post date: [July 6, 2020, 2:05pm UTC](https://discuss.elastic.co/t/access-denied-while-opening-stack-monitoring-on-kibana-7-8/239947/4 "2020-07-06T14:05:26Z")
Thanks @chrisronline for your response.
Attached the full kibana.yml contents.
I'm not using dedicated monitoring node.
---
### Author:  [@chrisronline](https://discuss.elastic.co/u/chrisronline)
#### Post date: [July 6, 2020, 2:15pm UTC](https://discuss.elastic.co/t/access-denied-while-opening-stack-monitoring-on-kibana-7-8/239947/5 "2020-07-06T14:15:00Z")
Thanks for that.
Are you seeing any errors/warnings in the Kibana server log?
---
### Author:  [@vishakh](https://discuss.elastic.co/u/vishakh)
#### Post date: [July 6, 2020, 3:18pm UTC](https://discuss.elastic.co/t/access-denied-while-opening-stack-monitoring-on-kibana-7-8/239947/6 "2020-07-06T15:18:53Z")
```auto
{"type":"response","@timestamp":"2020-07-06T15:03:56Z","tags":[],"pid":7759,"method":"post","statusCode":403,"req":{"url":"/api/monitoring/v1/clusters","method":"post","headers":{"host":"","x-real-ip":"","x-forwarded-for":"","x-forwarded-proto":"https","connection":"close","content-length":"101","user-agent":"Mozilla/5.0 (Windows NT 10.0; Win64; x64; rv:78.0) Gecko/20100101 Firefox/78.0","accept":"application/json, text/plain, */*","accept-language":"en-US,en;q=0.5","accept-encoding":"gzip, deflate, br","content-type":"application/json;charset=utf-8","kbn-version":"7.8.0","origin":"https://","referer":"https:///app/monitoring"},"remoteAddress":"127.0.0.1","userAgent":"127.0.0.1","referer":"https:///app/monitoring"},"res":{"statusCode":403,"responseTime":61,"contentLength":9},"message":"POST /api/monitoring/v1/clusters 403 61ms - 9.0B"}
{"type":"response","@timestamp":"2020-07-06T15:03:56Z","tags":[],"pid":7759,"method":"get","statusCode":200,"req":{"url":"/api/monitoring/v1/check_access","method":"get","headers":{"host":"","x-real-ip":"","x-forwarded-for":"","x-forwarded-proto":"https","connection":"close","user-agent":"Mozilla/5.0 (Windows NT 10.0; Win64; x64; rv:78.0) Gecko/20100101 Firefox/78.0","accept":"application/json, text/plain, */*","accept-language":"en-US,en;q=0.5","accept-encoding":"gzip, deflate, br","kbn-version":"7.8.0","referer":"https:///app/monitoring"},"remoteAddress":"127.0.0.1","userAgent":"127.0.0.1","referer":"https:///app/monitoring"},"res":{"statusCode":200,"responseTime":26,"contentLength":9},"message":"GET /api/monitoring/v1/check_access 200 26ms - 9.0B"}
{"type":"log","@timestamp":"2020-07-06T15:03:56Z","tags":["error","plugins","monitoring","monitoring"],"pid":7759,"message":"{ Error: [security_exception] action [indices:data/read/search[can_match]] is unauthorized for user [elastic] (and) [security_exception] action [indices:data/read/search[can_match]] is unauthorized for user [elastic]\n at respond (/usr/share/kibana/node_modules/elasticsearch/src/lib/transport.js:349:15)\n at checkRespForFailure (/usr/share/kibana/node_modules/elasticsearch/src/lib/transport.js:306:7)\n at HttpConnector. (/usr/share/kibana/node_modules/elasticsearch/src/lib/connectors/http.js:173:7)\n at IncomingMessage.wrapper (/usr/share/kibana/node_modules/elasticsearch/node_modules/lodash/lodash.js:4929:19)\n at IncomingMessage.emit (events.js:203:15)\n at endReadableNT (_stream_readable.js:1145:12)\n at process._tickCallback (internal/process/next_tick.js:63:19)\n status: 403,\n displayName: 'AuthorizationException',\n message:\n '[security_exception] action [indices:data/read/search[can_match]] is unauthorized for user [elastic] (and) [security_exception] action [indices:data/read/search[can_match]] is unauthorized for user [elastic]',\n path:\n '/*%3A.monitoring-es-6-*%2C*%3A.monitoring-es-7-*%2C.monitoring-es-6-*%2C.monitoring-es-7-*/_search',\n query:\n { size: 10000,\n ignore_unavailable: true,\n filter_path:\n 'hits.hits._index,hits.hits._source.cluster_uuid,hits.hits._source.cluster_name,hits.hits._source.version,hits.hits._source.license.status,hits.hits._source.license.type,hits.hits._source.license.issue_date,hits.hits._source.license.expiry_date,hits.hits._source.license.expiry_date_in_millis,hits.hits._source.cluster_stats,hits.hits._source.cluster_state,hits.hits._source.cluster_settings.cluster.metadata.display_name' },\n body:\n { error:\n { root_cause: [Array],\n type: 'search_phase_execution_exception',\n reason: 'all shards failed',\n phase: 'can_match',\n grouped: true,\n failed_shards: [Array] },\n status: 403 },\n statusCode: 403,\n response:\n '{\"error\":{\"root_cause\":[{\"type\":\"security_exception\",\"reason\":\"action [indices:data/read/search[can_match]] is unauthorized for user [elastic]\"},{\"type\":\"security_exception\",\"reason\":\"action [indices:data/read/search[can_match]] is unauthorized for user [elastic]\"}],\"type\":\"search_phase_execution_exception\",\"reason\":\"all shards failed\",\"phase\":\"can_match\",\"grouped\":true,\"failed_shards\":[{\"shard\":0,\"index\":\".monitoring-es-7-2020.07.05\",\"node\":\"vWNN1kzSQzaGR6M9BvY4lw\",\"reason\":{\"type\":\"security_exception\",\"reason\":\"action [indices:data/read/search[can_match]] is unauthorized for user [elastic]\",\"caused_by\":{\"type\":\"illegal_state_exception\",\"reason\":\"There are no external requests known to support wildcards that don\\'t support replacing their indices\"}}},{\"shard\":0,\"index\":\".monitoring-es-7-2020.07.06\",\"node\":\"93kgxcPJTyWU1mttNFNlug\",\"reason\":{\"type\":\"security_exception\",\"reason\":\"action [indices:data/read/search[can_match]] is unauthorized for user [elastic]\",\"caused_by\":{\"type\":\"illegal_state_exception\",\"reason\":\"There are no external requests known to support wildcards that don\\'t support replacing their indices\"}}}]},\"status\":403}',\n toString: [Function],\n toJSON: [Function] }"}
{"type":"response","@timestamp":"2020-07-06T15:03:56Z","tags":[],"pid":7759,"method":"post","statusCode":403,"req":{"url":"/api/monitoring/v1/clusters","method":"post","headers":{"host":"","x-real-ip":"","x-forwarded-for":"","x-forwarded-proto":"https","connection":"close","content-length":"101","user-agent":"Mozilla/5.0 (Windows NT 10.0; Win64; x64; rv:78.0) Gecko/20100101 Firefox/78.0","accept":"application/json, text/plain, */*","accept-language":"en-US,en;q=0.5","accept-encoding":"gzip, deflate, br","content-type":"application/json;charset=utf-8","kbn-version":"7.8.0","origin":"https://","referer":"https:///app/monitoring"},"remoteAddress":"127.0.0.1","userAgent":"127.0.0.1","referer":"https:///app/monitoring"},"res":{"statusCode":403,"responseTime":63,"contentLength":9},"message":"POST /api/monitoring/v1/clusters 403 63ms - 9.0B"}
```
@chrisronline Above is the kibana-log
---
### Author:  [@vishakh](https://discuss.elastic.co/u/vishakh)
#### Post date: [July 6, 2020, 5:03pm UTC](https://discuss.elastic.co/t/access-denied-while-opening-stack-monitoring-on-kibana-7-8/239947/7 "2020-07-06T17:03:02Z")
Issue Resolved. There was a typo in one of the ELK-Cluster Node yml conf. file
Rectifying and fixing it resolved the issue.
I'm able to access stack-monitoring service successfully.
Thank You @chrisronline
---
### Author:  [@vishakh](https://discuss.elastic.co/u/vishakh)
#### Post date: [July 6, 2020, 5:37pm UTC](https://discuss.elastic.co/t/access-denied-while-opening-stack-monitoring-on-kibana-7-8/239947/8 "2020-07-06T17:37:55Z")
Summary: `xpack.security.enabled: true` should be enabled on ALL elasticsearch nodes
---
### Author:  [@system](https://discuss.elastic.co/u/system)
#### Post date: [August 3, 2020, 5:37pm UTC](https://discuss.elastic.co/t/access-denied-while-opening-stack-monitoring-on-kibana-7-8/239947/9 "2020-08-03T17:37:58Z")
This topic was automatically closed 28 days after the last reply. New replies are no longer allowed.