# Average bucket in histogram change when time filter change
**URL:** https://discuss.elastic.co/t/average-bucket-in-histogram-change-when-time-filter-change/258285
**Category:** Kibana
**Created:** [December 10, 2020, 2:10pm UTC](https://discuss.elastic.co/t/average-bucket-in-histogram-change-when-time-filter-change/258285 "2020-12-10T14:10:37Z")
**Posts on this page:** 9
**Page:** 1
### Author:  [@vbarai](https://discuss.elastic.co/u/vbarai)
#### Post date: [December 10, 2020, 2:10pm UTC](https://discuss.elastic.co/t/average-bucket-in-histogram-change-when-time-filter-change/258285/1 "2020-12-10T14:10:37Z")
Hi All,
I am using latest ELK 7.10. I am facing weired issue with the Lens and Average Bucket Histogram.
**STEP 1 :** Created 4 Index for Dec-2020 Days as below
idx\_agg\_test\_20201201
idx\_agg\_test\_20201207
idx\_agg\_test\_20201208
idx\_agg\_test\_20201204
Each index has a data like below:
```auto
{
"_index" : "idx_agg_test_20201208",
"_type" : "_doc",
"_id" : "GmbaR3YBgolC41zZSJIJ",
"_score" : 1.0,
"_source" : {
"date" : "2020-12-08T00:00:00",
"category" : "eae5042914726c0103e9822d48cf6f74",
"amount" : 4943.82
}
```
Each index is at the maxof 20 MB having 2 shard (p+r) with 1 segment each.
Here is the record count of each index
```auto
date , count(1)
2020-12-01T00:00:00.000Z, 458211
2020-12-04T00:00:00.000Z, 350433
2020-12-07T00:00:00.000Z, 327896
2020-12-08T00:00:00.000Z, 327327
```
**STEP 2 :** Create a aliase for these index
```auto
GET /_alias/alias_mtd
Output=>
{
"idx_agg_test_20201201" : {"aliases" : {"alias_mtd" : { }}},
"idx_agg_test_20201207" : {"aliases" : {"alias_mtd" : { }}},
"idx_agg_test_20201208" : {"aliases" : {"alias_mtd" : { }}},
"idx_agg_test_20201204" : {"aliases" : {"alias_mtd" : { }}}
}
```
**STEP 3:** Plot Average Metric Visualisation on alias\_mtd.
**Metrics** : Aggregation -\> Average Bucket
|==\> Bucket -\> Aggregation: Date Histogram, Field : date, Minimum interval : Day
|=\> Metric -\> Aggregation : SUM, Field : Amount
**Buckets** : Aggregation : Term , Field : date
You will get something like below. Note Time interval is "Last 30 Days".
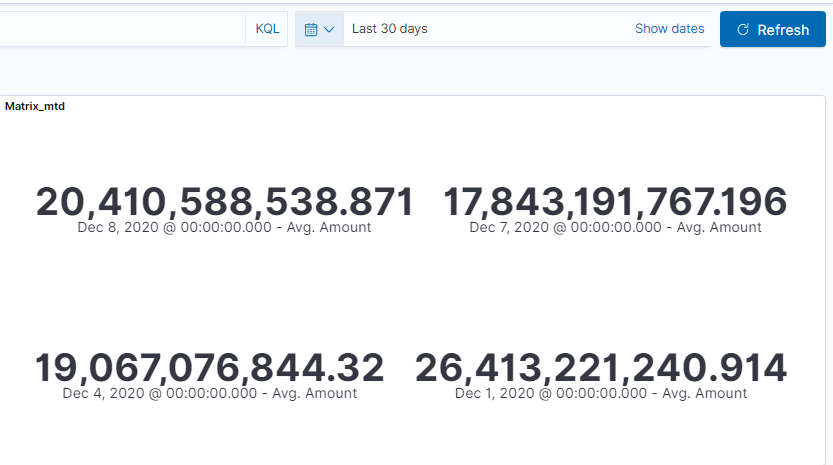
**STEP 4:** Change Time Range to 2 year. Just by changing a time range result is different. It is still showing same Dates Dec 1, Dec 4, Dec 7 and Dec 8, but values are different.
Note, there is no change happend if you change time range for Last 30, 60, 90 or 1 year. It only happen if you select "Last 2 year" and beyond.

**STEP 5:** Simillar issues observed while working with Lens Pie Chart while taking a count on alias\_mtd. This time there is change in date itself.
Notice date "2020-11-30" this date is not present in anywhere in those 4 index.
 
---
### Author:  [@lukas](https://discuss.elastic.co/u/lukas)
#### Post date: [December 10, 2020, 5:23pm UTC](https://discuss.elastic.co/t/average-bucket-in-histogram-change-when-time-filter-change/258285/2 "2020-12-10T17:23:30Z")
Hmm, this does seem strange. Do you mind using the "Inspect" functionality and pasting in the request/response here so we can do a little investigation?
---
### Author:  [@vbarai](https://discuss.elastic.co/u/vbarai)
#### Post date: [December 11, 2020, 4:08am UTC](https://discuss.elastic.co/t/average-bucket-in-histogram-change-when-time-filter-change/258285/3 "2020-12-11T04:08:31Z")
> [@lukas](#):
>
> Inspect
Thanks Lukas for responding to my query:
Here is the inspect details of Metrics chart. There inspect option is not there for Lens-Pie chart:
Seems like when I select 2 year there is a change in "calendar\_interval": "1d" to "calendar\_interval": "1w".
**Request [Last 1 Year]**
```auto
{
"aggs": {
"2": {
"terms": {
"field": "date",
"order": {
"_key": "desc"
},
"size": 50
},
"aggs": {
"1": {
"avg_bucket": {
"buckets_path": "1-bucket>1-metric"
}
},
"1-bucket": {
"date_histogram": {
"field": "date",
"calendar_interval": "1d",
"time_zone": "UTC",
"min_doc_count": 1
},
"aggs": {
"1-metric": {
"sum": {
"field": "amount"
}
}
}
}
}
}
},
"size": 0,
"stored_fields": [
"*"
],
"script_fields": {},
"docvalue_fields": [
{
"field": "date",
"format": "date_time"
}
],
"_source": {
"excludes": []
},
"query": {
"bool": {
"must": [],
"filter": [
{
"match_all": {}
},
{
"range": {
"date": {
"gte": "2019-12-11T04:04:27.102Z",
"lte": "2020-12-11T04:04:27.103Z",
"format": "strict_date_optional_time"
}
}
}
],
"should": [],
"must_not": []
}
}
}
```
**Response [Last 1 Year]**
```auto
{
"took": 4,
"timed_out": false,
"_shards": {
"total": 4,
"successful": 4,
"skipped": 0,
"failed": 0
},
"hits": {
"total": 1463867,
"max_score": null,
"hits": []
},
"aggregations": {
"2": {
"doc_count_error_upper_bound": 0,
"sum_other_doc_count": 0,
"buckets": [
{
"1": {
"value": 20410588538.871193
},
"key": 1607385600000,
"key_as_string": "2020-12-08T00:00:00.000Z",
"doc_count": 327327,
"1-bucket": {
"buckets": [
{
"key_as_string": "2020-12-08T00:00:00.000Z",
"key": 1607385600000,
"doc_count": 327327,
"1-metric": {
"value": 20410588538.871193
}
}
]
}
},
{
"1": {
"value": 17843191767.196167
},
"key": 1607299200000,
"key_as_string": "2020-12-07T00:00:00.000Z",
"doc_count": 327896,
"1-bucket": {
"buckets": [
{
"key_as_string": "2020-12-07T00:00:00.000Z",
"key": 1607299200000,
"doc_count": 327896,
"1-metric": {
"value": 17843191767.196167
}
}
]
}
},
{
"1": {
"value": 19067076844.31994
},
"key": 1607040000000,
"key_as_string": "2020-12-04T00:00:00.000Z",
"doc_count": 350433,
"1-bucket": {
"buckets": [
{
"key_as_string": "2020-12-04T00:00:00.000Z",
"key": 1607040000000,
"doc_count": 350433,
"1-metric": {
"value": 19067076844.31994
}
}
]
}
},
{
"1": {
"value": 26413221240.91387
},
"key": 1606780800000,
"key_as_string": "2020-12-01T00:00:00.000Z",
"doc_count": 458211,
"1-bucket": {
"buckets": [
{
"key_as_string": "2020-12-01T00:00:00.000Z",
"key": 1606780800000,
"doc_count": 458211,
"1-metric": {
"value": 26413221240.91387
}
}
]
}
}
]
}
}
}
```
**Request [Last 2 years]**
```auto
{
"aggs": {
"2": {
"terms": {
"field": "date",
"order": {
"_key": "desc"
},
"size": 50
},
"aggs": {
"1": {
"avg_bucket": {
"buckets_path": "1-bucket>1-metric"
}
},
"1-bucket": {
"date_histogram": {
"field": "date",
"calendar_interval": "1w",
"time_zone": "UTC",
"min_doc_count": 1
},
"aggs": {
"1-metric": {
"sum": {
"field": "amount"
}
}
}
}
}
}
},
"size": 0,
"stored_fields": [
"*"
],
"script_fields": {},
"docvalue_fields": [
{
"field": "date",
"format": "date_time"
}
],
"_source": {
"excludes": []
},
"query": {
"bool": {
"must": [],
"filter": [
{
"match_all": {}
},
{
"range": {
"date": {
"gte": "2018-12-11T04:07:04.126Z",
"lte": "2020-12-11T04:07:04.126Z",
"format": "strict_date_optional_time"
}
}
}
],
"should": [],
"must_not": []
}
}
}
```
**Responce [Last 2 years]**
```auto
{
"took": 4,
"timed_out": false,
"_shards": {
"total": 4,
"successful": 4,
"skipped": 0,
"failed": 0
},
"hits": {
"total": 1463867,
"max_score": null,
"hits": []
},
"aggregations": {
"2": {
"doc_count_error_upper_bound": 0,
"sum_other_doc_count": 0,
"buckets": [
{
"1": {
"value": 20410588538.871193
},
"key": 1607385600000,
"key_as_string": "2020-12-08T00:00:00.000Z",
"doc_count": 327327,
"1-bucket": {
"buckets": [
{
"key_as_string": "2020-12-07T00:00:00.000Z",
"key": 1607299200000,
"doc_count": 327327,
"1-metric": {
"value": 20410588538.871193
}
}
]
}
},
{
"1": {
"value": 17843191767.196167
},
"key": 1607299200000,
"key_as_string": "2020-12-07T00:00:00.000Z",
"doc_count": 327896,
"1-bucket": {
"buckets": [
{
"key_as_string": "2020-12-07T00:00:00.000Z",
"key": 1607299200000,
"doc_count": 327896,
"1-metric": {
"value": 17843191767.196167
}
}
]
}
},
{
"1": {
"value": 19067076844.31994
},
"key": 1607040000000,
"key_as_string": "2020-12-04T00:00:00.000Z",
"doc_count": 350433,
"1-bucket": {
"buckets": [
{
"key_as_string": "2020-11-30T00:00:00.000Z",
"key": 1606694400000,
"doc_count": 350433,
"1-metric": {
"value": 19067076844.31994
}
}
]
}
},
{
"1": {
"value": 26413221240.91387
},
"key": 1606780800000,
"key_as_string": "2020-12-01T00:00:00.000Z",
"doc_count": 458211,
"1-bucket": {
"buckets": [
{
"key_as_string": "2020-11-30T00:00:00.000Z",
"key": 1606694400000,
"doc_count": 458211,
"1-metric": {
"value": 26413221240.91387
}
}
]
}
}
]
}
}
}
```
---
### Author:  [@vbarai](https://discuss.elastic.co/u/vbarai)
#### Post date: [December 14, 2020, 4:18am UTC](https://discuss.elastic.co/t/average-bucket-in-histogram-change-when-time-filter-change/258285/4 "2020-12-14T04:18:25Z")
@lukas Do you have any suggestion on issue I am facing?
---
### Author:  [@xeraa](https://discuss.elastic.co/u/xeraa)
#### Post date: [December 15, 2020, 10:28pm UTC](https://discuss.elastic.co/t/average-bucket-in-histogram-change-when-time-filter-change/258285/5 "2020-12-15T22:28:28Z")
So what are you trying to achieve here in the end? If the bucket-size (or time) changes, I'm not surprised that the end result changes as well. Do you want to keep it at daily buckets or what is the question or goal?
---
### Author:  [@vbarai](https://discuss.elastic.co/u/vbarai)
#### Post date: [December 16, 2020, 4:44am UTC](https://discuss.elastic.co/t/average-bucket-in-histogram-change-when-time-filter-change/258285/6 "2020-12-16T04:44:38Z")
Hi Xeraa, goal is to get (Sum of Amount of all Days) / (Number of Days) which is avg amount over days. I purposely split the data by date to post it in discussion forum to see what is going on. In actual case I wont.
What is your opinion on Lens pie change issue mentioned above? Why it changing a date which is not there in data? Isnt it is a case of wrong reporting and there is a huge bug in the application?
Regarding your comment "I'm not surprised that the end result changes as well", If number of days and amount is not changing then why end result change just by chaning a Time range? This is giving a wrong result and no one will trust report. It defeat a purpose all together.
---
### Author:  [@xeraa](https://discuss.elastic.co/u/xeraa)
#### Post date: [December 28, 2020, 2:04am UTC](https://discuss.elastic.co/t/average-bucket-in-histogram-change-when-time-filter-change/258285/7 "2020-12-28T02:04:04Z")
Let me get back to this:
1. I was mostly looking at the JSON query and response since those are much easier to figure out than the Lens screenshot.
2. If you switch the bucket size from day to week, I'm not surprised the results change — you are moving from average per day to average per week, which is different.
3. I'm not sure how you want to get the daily average out of a pie chart. Shouldn't that be a bar chart with one bar per day? Like this:
PS: 20MB for one index is very small — you're having a lot of overhead just from the amount of shards. Either switch to monthly indices or use ILM to create them with 50GB each.
---
### Author:  [@vbarai](https://discuss.elastic.co/u/vbarai)
#### Post date: [December 28, 2020, 5:15am UTC](https://discuss.elastic.co/t/average-bucket-in-histogram-change-when-time-filter-change/258285/8 "2020-12-28T05:15:09Z")
@xeraa Seems there is so many disconnects, let me clarify on that..
**for #2:** I am not moving bucket interval from days to week. It is done by Kibana automatically.
**for #3:** Ideally it could be pie chart or bar char. Other application like Tableau doesnt restrict which metric you want to plot on pie/bar. I want to show a pie chart to see the market coverage. To quantify how much market cover by which category, for us daily/MTD/YTD avgerage make more sence than sum. Hence Pie chart to plot average value
**for #4:** @timestamp doesnt make any sence for us because data is not real-time. We have other date column on which we have to trust for our analysis. Our dashboard is doing analysis of Daily/MTD/YTD so just 1 bucket is of no use.
**for #5:** 20 MB index is what I am experimenting on. Our actual index is much larger in GBs.
Quick question on this when you said "index with 50GB each" Does it mean total size/ each shard size/each segment size.
**Solution of above issue:** @xeraa we got a solution to proble I mentioned with the help of Elastic team. The solution is to increase a " **Maximum buckets**" property in advance setting to higer values like **2000**.
Thanks for all your help. Will reach out to you for any more queries on ELK.
---
### Author:  [@system](https://discuss.elastic.co/u/system)
#### Post date: [January 25, 2021, 5:15am UTC](https://discuss.elastic.co/t/average-bucket-in-histogram-change-when-time-filter-change/258285/9 "2021-01-25T05:15:18Z")
This topic was automatically closed 28 days after the last reply. New replies are no longer allowed.