# Bar graph individual color for each entry?
**URL:** https://discuss.elastic.co/t/bar-graph-individual-color-for-each-entry/202263
**Category:** Kibana
**Created:** [October 4, 2019, 2:07am UTC](https://discuss.elastic.co/t/bar-graph-individual-color-for-each-entry/202263 "2019-10-04T02:07:38Z")
**Posts on this page:** 2
**Page:** 1
### Author:  [@Sjaak01](https://discuss.elastic.co/u/Sjaak01)
#### Post date: [October 4, 2019, 2:07am UTC](https://discuss.elastic.co/t/bar-graph-individual-color-for-each-entry/202263/1 "2019-10-04T02:07:38Z")
Hi,
I know this must be very easy but I can't figure it out. I have some documents that contain an IP and a country. I want to create a bar graph that shows the count of each country but also gives an individual color to each country.
Similar to this
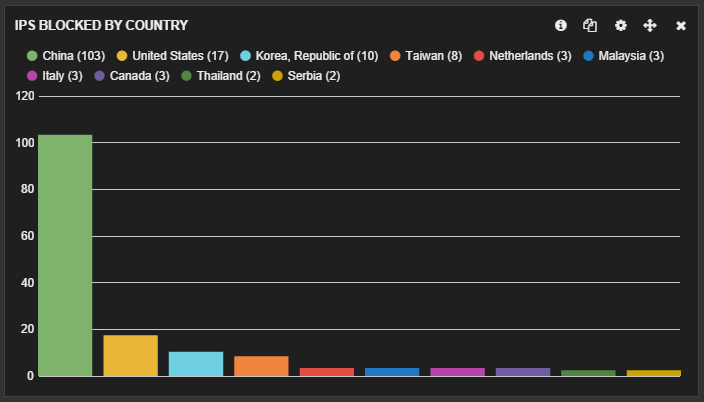
However something simple as metric: count and term: country will give a separate bar for each country, but not a individual color.
Edit: Splitting the chart gave the desired result.
---
### Author:  [@Marius\_Dragomir](https://discuss.elastic.co/u/Marius_Dragomir)
#### Post date: [October 11, 2019, 1:59pm UTC](https://discuss.elastic.co/t/bar-graph-individual-color-for-each-entry/202263/2 "2019-10-11T13:59:56Z")