# Can We Filter Data at the Chart-level by Column in Visual Mode?
**URL:** https://discuss.elastic.co/t/can-we-filter-data-at-the-chart-level-by-column-in-visual-mode/185606
**Category:** Kibana
**Created:** [June 13, 2019, 10:11am UTC](https://discuss.elastic.co/t/can-we-filter-data-at-the-chart-level-by-column-in-visual-mode/185606 "2019-06-13T10:11:35Z")
**Posts on this page:** 6
**Page:** 1
### Author:  [@Zany](https://discuss.elastic.co/u/Zany)
#### Post date: [June 13, 2019, 10:11am UTC](https://discuss.elastic.co/t/can-we-filter-data-at-the-chart-level-by-column-in-visual-mode/185606/1 "2019-06-13T10:11:35Z")
In the Discovery Mode, I know that we can create a query (e.g. type: http) to filter out data before building visualizations. However, I do not want to do that. I need the unfiltered data.
I want to create a Data Table in Visualize Mode with its 2nd column to display count where **Attempt = "Failed"**. No. of Failed Attempts is subset of Total No. of Attempts. Can we filter data at the chart-level by column in Visual mode?
| Session # | Attempt |
| --- | --- |
| 1 | Failed |
| 1 | Failed |
| 1 | Passed |
| 2 | Failed |
| 2 | Passed |
| ... | ... |
**Total No. of Attempts** : count of Attempt
**No. of Failed Attempts** : count of Attempt where Attempt is "Failed"
| **Session #** | **Total No. of Attempts** | **No. of Failed Attempts** |
| --- | --- | --- |
| 1 | 3 | 2 |
| 2 | 2 | 1 |
| ... | ... | ... |
---
### Author:  [@azasypkin](https://discuss.elastic.co/u/azasypkin)
#### Post date: [June 14, 2019, 8:47am UTC](https://discuss.elastic.co/t/can-we-filter-data-at-the-chart-level-by-column-in-visual-mode/185606/2 "2019-06-14T08:47:33Z")
Hi @Zany,
If `Total No. of Attempts` and `No. of Failed Attempts` could be rows instead of columns, you could use `Filter` aggregation to show the data you want, like demonstrated here: [Data table visualization with custom aggregation query](https://discuss.elastic.co/t/data-table-visualization-with-custom-aggregation-query/138637/2).
Best,
Oleg
---
### Author:  [@Zany](https://discuss.elastic.co/u/Zany)
#### Post date: [June 14, 2019, 9:35am UTC](https://discuss.elastic.co/t/can-we-filter-data-at-the-chart-level-by-column-in-visual-mode/185606/3 "2019-06-14T09:35:43Z")
Thank you for sharing the reference. You did answered my question on whether we can filter data at the chart-level. However, I need them to be columns instead of rows, because transaction records will be populated in rows.
Do you think scripted fields will help in my requirement?
---
### Author:  [@azasypkin](https://discuss.elastic.co/u/azasypkin)
#### Post date: [June 14, 2019, 9:45am UTC](https://discuss.elastic.co/t/can-we-filter-data-at-the-chart-level-by-column-in-visual-mode/185606/4 "2019-06-14T09:45:25Z")
I don't think this is supported currently, but can be tracked [here](https://github.com/elastic/kibana/issues/3620). Also there is a chance that a 3rd-party [kibana-enhanced-table plugin](https://github.com/fbaligand/kibana-enhanced-table) can do what you want.
---
### Author:  [@Zany](https://discuss.elastic.co/u/Zany)
#### Post date: [June 18, 2019, 3:42am UTC](https://discuss.elastic.co/t/can-we-filter-data-at-the-chart-level-by-column-in-visual-mode/185606/5 "2019-06-18T03:42:43Z")
The 3rd party [kibana-enhanced-table plugin](https://github.com/fbaligand/kibana-enhanced-table) looks amazing. I have yet to install it on my server but I think it can do exactly what I wanted. Thanks. Anyway, I have tried the native Split Table by Columns option, but it looks really weird.

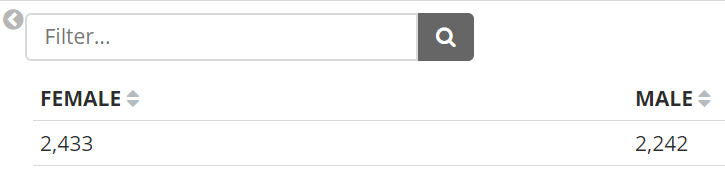
**Update 19th Jun 2019:**
Tried the enhanced table and it looks great!
---
### Author:  [@system](https://discuss.elastic.co/u/system)
#### Post date: [July 16, 2019, 3:42am UTC](https://discuss.elastic.co/t/can-we-filter-data-at-the-chart-level-by-column-in-visual-mode/185606/6 "2019-07-16T03:42:50Z")
This topic was automatically closed 28 days after the last reply. New replies are no longer allowed.