### Author:  [@bz\_Os](https://discuss.elastic.co/u/bz_Os)
#### Post date: [May 1, 2018, 6:24pm UTC](https://discuss.elastic.co/t/cant-see-bro-logs-in-kibana/130142/1 "2018-05-01T18:24:33Z")
i attempt to seend bro logs to logstach,i am using filebeat for this when i open tab discover i see only the logs 28-04-2018 and 29-04-2018 but i cant find the current log and the 30th
i want to test only connection log
for the configuration : filebeat.yml
```auto
filebeat.prospectors:
- input_type: log
paths:
- "/usr/local/bro/logs/current/conn.log"
fields:
type: "bro-conn"
fields_under_root: true
#----------------------------- Logstash output --------------------------------
output.logstash:
# The Logstash hosts
hosts: ["logstash:5044"]
```
for the bro-conn-log.conf
```auto
input {
beats {
port => 5044
columns => "localhost"
}
}
filter {
#Let's get rid of those header lines; they begin with a hash
if [message] =~ /^#/ {
drop { }
}
#Now, using the csv filter, we can define the Bro log fields
if [type] == "bro-conn_log" {
csv {
columns => ["ts","uid","id.orig_h","id.orig_p","id.resp_h","id.resp_p","proto","service","duration","orig_bytes","resp_bytes","conn_state","local_orig","missed_bytes","history","orig_pkts","orig_ip_bytes","resp_pkts","resp_ip_bytes","tunnel_parents"]
#If you use a custom delimiter, change the following value in between the quotes to your delimiter. Otherwise, insert a literal in between the two quotes on your logstash system, use a text editor like nano that doesn't convert tabs to spaces.
separator => " "
}
#Let's convert our timestamp into the 'ts' field, so we can use Kibana features natively
date {
match => ["ts", "UNIX"]
}
# add geoip attributes
geoip {
source => "id.orig_h"
target => "orig_geoip"
}
geoip {
source => "id.resp_h"
target => "resp_geoip"
}
#The following makes use of the translate filter (logstash contrib) to convert conn_state into human text. Saves having to look up values for packet introspection
translate {
field => "conn_state"
destination => "conn_state_full"
dictionary => [
"S0", "Connection attempt seen, no reply",
"S1", "Connection established, not terminated",
"S2", "Connection established and close attempt by originator seen (but no reply from responder)",
"S3", "Connection established and close attempt by responder seen (but no reply from originator)",
"SF", "Normal SYN/FIN completion",
"REJ", "Connection attempt rejected",
"RSTO", "Connection established, originator aborted (sent a RST)",
"RSTR", "Established, responder aborted",
"RSTOS0", "Originator sent a SYN followed by a RST, we never saw a SYN-ACK from the responder",
"RSTRH", "Responder sent a SYN ACK followed by a RST, we never saw a SYN from the (purported) originator",
"SH", "Originator sent a SYN followed by a FIN, we never saw a SYN ACK from the responder (hence the connection was 'half' open)",
"SHR", "Responder sent a SYN ACK followed by a FIN, we never saw a SYN from the originator",
"OTH", "No SYN seen, just midstream traffic (a 'partial connection' that was not later closed)"
]
}
mutate {
convert => ["id.orig_p", "integer"]
convert => ["id.resp_p", "integer"]
convert => ["orig_bytes", "integer"]
convert => ["duration", "float"]
convert => ["resp_bytes", "integer"]
convert => ["missed_bytes", "integer"]
convert => ["orig_pkts", "integer"]
convert => ["orig_ip_bytes", "integer"]
convert => ["resp_pkts", "integer"]
convert => ["resp_ip_bytes", "integer"]
rename => ["id.orig_h", "id_orig_host"]
rename => ["id.orig_p", "id_orig_port"]
rename => ["id.resp_h", "id_resp_host"]
rename => ["id.resp_p", "id_resp_port"]
}
}
}
output {
# stdout { codec => rubydebug }
elasticsearch {
hosts => ["localhost:9200"]
}
}
```
---
### Author:  [@spalger](https://discuss.elastic.co/u/spalger)
#### Post date: [May 1, 2018, 6:35pm UTC](https://discuss.elastic.co/t/cant-see-bro-logs-in-kibana/130142/2 "2018-05-01T18:35:41Z")
What index pattern are you using in Kibana? `logstash-*`?
Is the logstash service logging anything that might indicate an issues?
Can you query elasticsearch with Dev Tools/Console in kibana and see the logs you are looking for?
```auto
GET /logstash-2018.04.30/_search
```
---
### Author:  [@darkmoon](https://discuss.elastic.co/u/darkmoon)
#### Post date: [May 1, 2018, 6:51pm UTC](https://discuss.elastic.co/t/cant-see-bro-logs-in-kibana/130142/3 "2018-05-01T18:51:06Z")
As a note, Bro will send you json formatted logs, which might be easier to deal with.
The 6.2 docs show dictionary using the =\> { key =\> value, key =\> value, ...} syntax, rather than =\> [key, value, key, value...]. I've had better luck with the former form.
Have you tried turning on your stdout output and seeing if it had anything?
And lastly, you know for a fact that you had incoming documents?
---
### Author:  [@bz\_Os](https://discuss.elastic.co/u/bz_Os)
#### Post date: [May 1, 2018, 8:58pm UTC](https://discuss.elastic.co/t/cant-see-bro-logs-in-kibana/130142/4 "2018-05-01T20:58:41Z")
yes i am using logstash-\* as index ,when i run GET /logstash-2018.04.30/\_search
in dev tool i have as response :
> ```
> {
> "error": {
> "root_cause": [
> {
> "type": "index_not_found_exception",
> "reason": "no such index",
> "resource.type": "index_or_alias",
> "resource.id": "logstash-2018.04.30",
> "index_uuid": "_na_",
> "index": "logstash-2018.04.30"
> }
> ],
> "type": "index_not_found_exception",
> "reason": "no such index",
> "resource.type": "index_or_alias",
> "resource.id": "logstash-2018.04.30",
> "index_uuid": "_na_",
> "index": "logstash-2018.04.30"
> },
> "status": 404
> }
>
> ```
---
### Author:  [@bz\_Os](https://discuss.elastic.co/u/bz_Os)
#### Post date: [May 1, 2018, 9:00pm UTC](https://discuss.elastic.co/t/cant-see-bro-logs-in-kibana/130142/5 "2018-05-01T21:00:12Z")
and for logstash log :
> ```
> [2018-05-01T21:35:31,633][INFO][logstash.modules.scaffold] Initializing module {:module_name=>"netflow", :directory=>"/usr/share/logstash/modules/netflow/configuration"}
> [2018-05-01T21:35:31,727][INFO][logstash.modules.scaffold] Initializing module {:module_name=>"fb_apache", :directory=>"/usr/share/logstash/modules/fb_apache/configuration"}
> [2018-05-01T21:36:25,573][ERROR][logstash.inputs.beats] Unknown setting 'columns' for beats
> [2018-05-01T21:36:25,672][ERROR][logstash.agent] Cannot create pipeline {:reason=>"Something is wrong with your configuration."}
> [2018-05-01T21:37:50,729][INFO][logstash.modules.scaffold] Initializing module {:module_name=>"netflow", :directory=>"/usr/share/logstash/modules/netflow/configuration"}
> [2018-05-01T21:37:50,820][INFO][logstash.modules.scaffold] Initializing module {:module_name=>"fb_apache", :directory=>"/usr/share/logstash/modules/fb_apache/configuration"}
> [2018-05-01T21:38:47,379][ERROR][logstash.inputs.beats] Unknown setting 'columns' for beats
> [2018-05-01T21:38:47,420][ERROR][logstash.agent] Cannot create pipeline {:reason=>"Something is wrong with your configuration."}
>
> ```
---
### Author:  [@darkmoon](https://discuss.elastic.co/u/darkmoon)
#### Post date: [May 1, 2018, 9:14pm UTC](https://discuss.elastic.co/t/cant-see-bro-logs-in-kibana/130142/6 "2018-05-01T21:14:11Z")
Oh, the beats input plugin doesn't have a columns parameter. Did you mean 'host'?
---
### Author:  [@bz\_Os](https://discuss.elastic.co/u/bz_Os)
#### Post date: [May 1, 2018, 9:29pm UTC](https://discuss.elastic.co/t/cant-see-bro-logs-in-kibana/130142/7 "2018-05-01T21:29:24Z")
i dont understand what mean the logs by Unknown setting 'columns' for beats
---
### Author:  [@bz\_Os](https://discuss.elastic.co/u/bz_Os)
#### Post date: [May 1, 2018, 9:38pm UTC](https://discuss.elastic.co/t/cant-see-bro-logs-in-kibana/130142/8 "2018-05-01T21:38:21Z")
for fb\_apache configuration
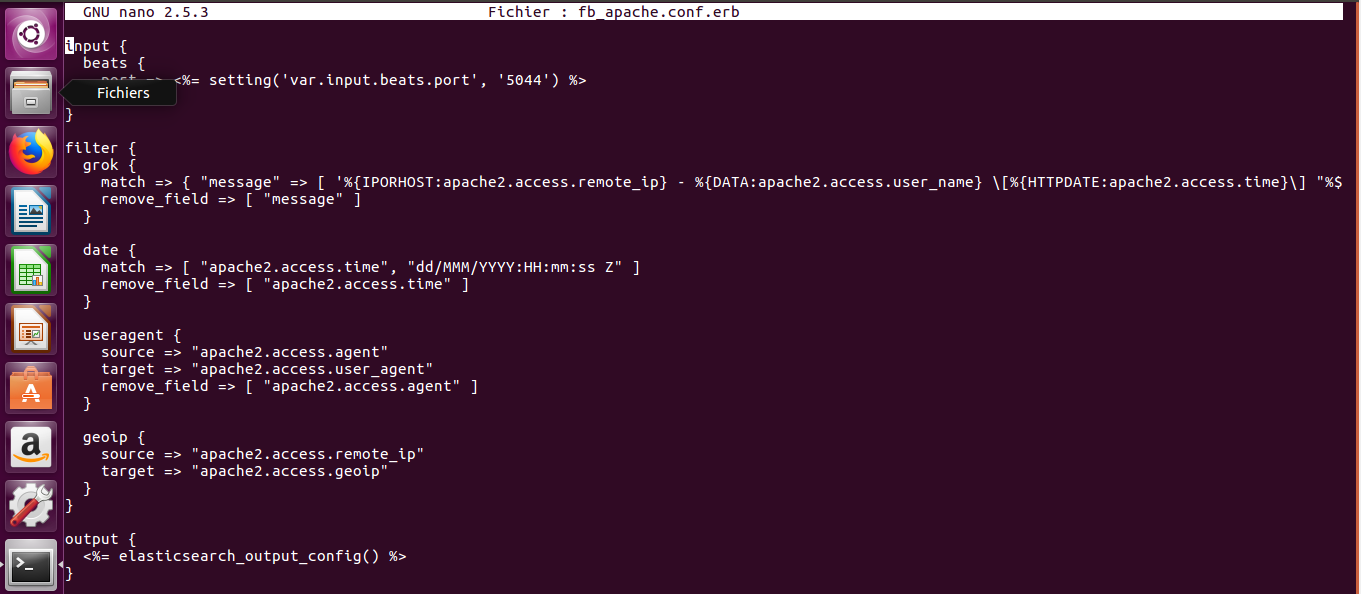
for netflow configuration

---
### Author:  [@bz\_Os](https://discuss.elastic.co/u/bz_Os)
#### Post date: [May 1, 2018, 11:47pm UTC](https://discuss.elastic.co/t/cant-see-bro-logs-in-kibana/130142/9 "2018-05-01T23:47:35Z")
this post can help you to help me i was explain in detail
> [@Cant see bro logs in kibana](https://discuss.elastic.co/t/cant-see-bro-logs-in-kibana/130142):
>
> i attempt to seend bro logs to logstach,i am using filebeat for this when i open tab discover i see only the logs 28-04-2018 and 29-04-2018 but i cant find the current log and the 30th i want to test only connection log for the configuration : filebeat.yml filebeat.prospectors: - input\_type: log paths: - "/usr/local/bro/logs/current/conn.log" fields: type: "bro-conn" fields\_under\_root: true #----------------------------- Logstash output -------------------------------- output…
---
### Author:  [@system](https://discuss.elastic.co/u/system)
#### Post date: [May 29, 2018, 11:50pm UTC](https://discuss.elastic.co/t/cant-see-bro-logs-in-kibana/130142/10 "2018-05-29T23:50:18Z")
This topic was automatically closed 28 days after the last reply. New replies are no longer allowed.