# CPU usage slowly climbs until ES needs a restart
**URL:** https://discuss.elastic.co/t/cpu-usage-slowly-climbs-until-es-needs-a-restart/38276
**Category:** Elasticsearch
**Created:** [January 3, 2016, 3:59pm UTC](https://discuss.elastic.co/t/cpu-usage-slowly-climbs-until-es-needs-a-restart/38276 "2016-01-03T15:59:45Z")
**Posts on this page:** 6
**Page:** 1
### Author:  [@travisbell](https://discuss.elastic.co/u/travisbell)
#### Post date: [January 3, 2016, 3:59pm UTC](https://discuss.elastic.co/t/cpu-usage-slowly-climbs-until-es-needs-a-restart/38276/1 "2016-01-03T15:59:45Z")
Hi everyone,
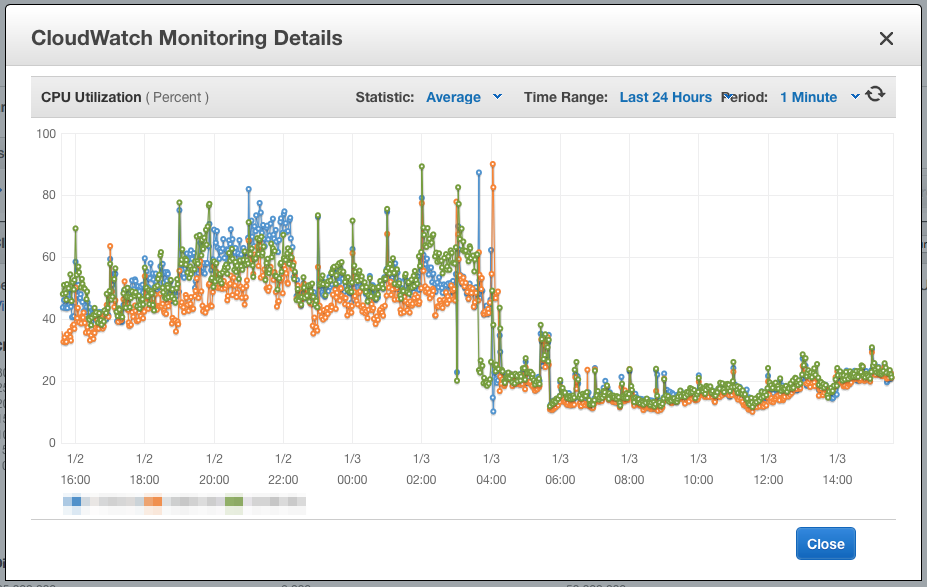
We're seeing kind of an annoying issue with our ES cluster which is that after 7-10 days (this is not a science, it's just whenever the problem becomes bad enough) the CPU ES is using is 2-3x more than after a service restart.
Let me put this a slightly other way just for clarity... ES runs fine for a while then all of a sudden we notice CPU usage start climbing even though the load (requests we're sending to ES) is the same. It climbs, and climbs and climbs until the latency of the search requests becomes high enough that is starts to affect availability. So we restart ES. Boom, just like that, with the same load as pre-restart we save 2-3x CPU and things will smooth out like this for again, 7-10 days until it all happens again. We've been in this loop now for 6 weeks.
Has anyone seen anything like this? Here are some graphs of before/after a restart (~4:00 on the graph, you can see the network doesn't change but then look at that CPU difference!)
[ ](http://files.travisbell.com/EC2_Management_Console_1C397895.png)[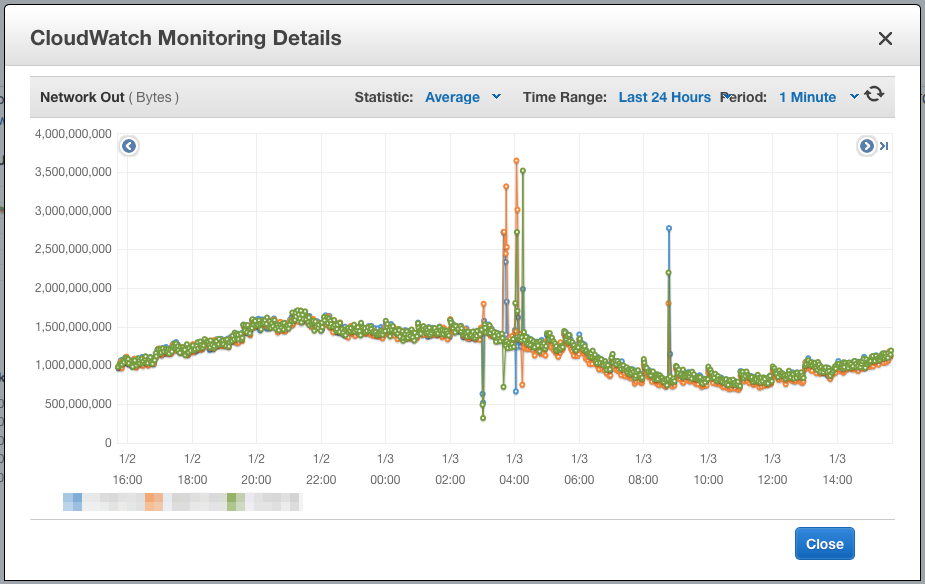 ](http://files.travisbell.com/EC2_Management_Console_1C3978E0.png)
This is ES 1.7.3 (java 1.8.0\_66) running on AWS c3.2xlarge's (15GB RAM) with a 7.5GB heap. I don't see Marvel reporting anything strange during these events. Aside from latency climbing with CPU, there is nothing out of the ordinary that I am able to discern.
Thanks in advance to anyone who can help shed some light, cheers!
---
### Author:  [@Christian\_Dahlqvist](https://discuss.elastic.co/u/Christian_Dahlqvist)
#### Post date: [January 3, 2016, 4:30pm UTC](https://discuss.elastic.co/t/cpu-usage-slowly-climbs-until-es-needs-a-restart/38276/2 "2016-01-03T16:30:29Z")
What does the [hot thread API](https://www.elastic.co/guide/en/elasticsearch/reference/current/cluster-nodes-hot-threads.html) show when the CPU utilisation is high? Is there anything in the logs that differ from when the cluster has been restarted?
---
### Author:  [@travisbell](https://discuss.elastic.co/u/travisbell)
#### Post date: [January 3, 2016, 4:52pm UTC](https://discuss.elastic.co/t/cpu-usage-slowly-climbs-until-es-needs-a-restart/38276/3 "2016-01-03T16:52:28Z")
Hi Christian,
I'll be sure to grab some snapshots when this happens next (in a week or so's time). We restarted the service last night so right now everything is running good. Here's a few grabs form right now, although ES is operating within the normal expectations right now.
>
---
### Author:  [@travisbell](https://discuss.elastic.co/u/travisbell)
#### Post date: [January 13, 2016, 3:31pm UTC](https://discuss.elastic.co/t/cpu-usage-slowly-climbs-until-es-needs-a-restart/38276/4 "2016-01-13T15:31:11Z")
Alright, so here we are again, 9 days later.
[ ](http://files.travisbell.com/EC2_Management_Console_1C46A2D9.png)[ ](http://files.travisbell.com/EC2_Management_Console_1C46A305.png)
I have a 6 hot thread calls here (this is before the restart):
>
>
> There are more than three files. show original
The "1100" host is the green host peaking at 100% CPU.
---
### Author:  [@travisbell](https://discuss.elastic.co/u/travisbell)
#### Post date: [April 11, 2016, 4:55pm UTC](https://discuss.elastic.co/t/cpu-usage-slowly-climbs-until-es-needs-a-restart/38276/5 "2016-04-11T16:55:24Z")
For the sake of any other potential user searching around and finding this thread, over on this other post [here](https://discuss.elastic.co/t/indexing-performance-degrading-over-time/40229/50?u=travisbell) it was mentioned that switching from G1 GC to CMS solved another user having a similar issue as this. We made this change on our stack and low and behold, this problem went away.
We even ran both GC's simultaneously on different nodes and the G1 nodes continued to act up while the CMS node was fine. It's been 15 days now and the CMS node hasn't needed a restart. Hope this can help any one who comes across this bizarre problem.
---
### Author:  [@system](https://discuss.elastic.co/u/system)
#### Post date: [July 5, 2017, 11:00pm UTC](https://discuss.elastic.co/t/cpu-usage-slowly-climbs-until-es-needs-a-restart/38276/6 "2017-07-05T23:00:39Z")