# Creating a cumalative sum visualization split on terms
**URL:** https://discuss.elastic.co/t/creating-a-cumalative-sum-visualization-split-on-terms/169576
**Category:** Kibana
**Created:** [February 22, 2019, 12:13pm UTC](https://discuss.elastic.co/t/creating-a-cumalative-sum-visualization-split-on-terms/169576 "2019-02-22T12:13:26Z")
**Posts on this page:** 6
**Page:** 1
### Author:  [@DrThyme](https://discuss.elastic.co/u/DrThyme)
#### Post date: [February 22, 2019, 12:13pm UTC](https://discuss.elastic.co/t/creating-a-cumalative-sum-visualization-split-on-terms/169576/1 "2019-02-22T12:13:26Z")
Hello!
I've been struggling with getting a visualization together which it I thought would be simple but it's proven harder than I thought so I must be missing something. Therefore I turn to the combined knowledge of the forum.
I need to be able to present the cumulative sum of events but split on event type over time. So I have documents where each document is an event, for simplicity let's say that each document only contains a timestamp and an event type.
Now just setting up a cumulative area chart is straight forward producing this.

However what I'm trying to achieve is something along these lines (paint to the rescue!)
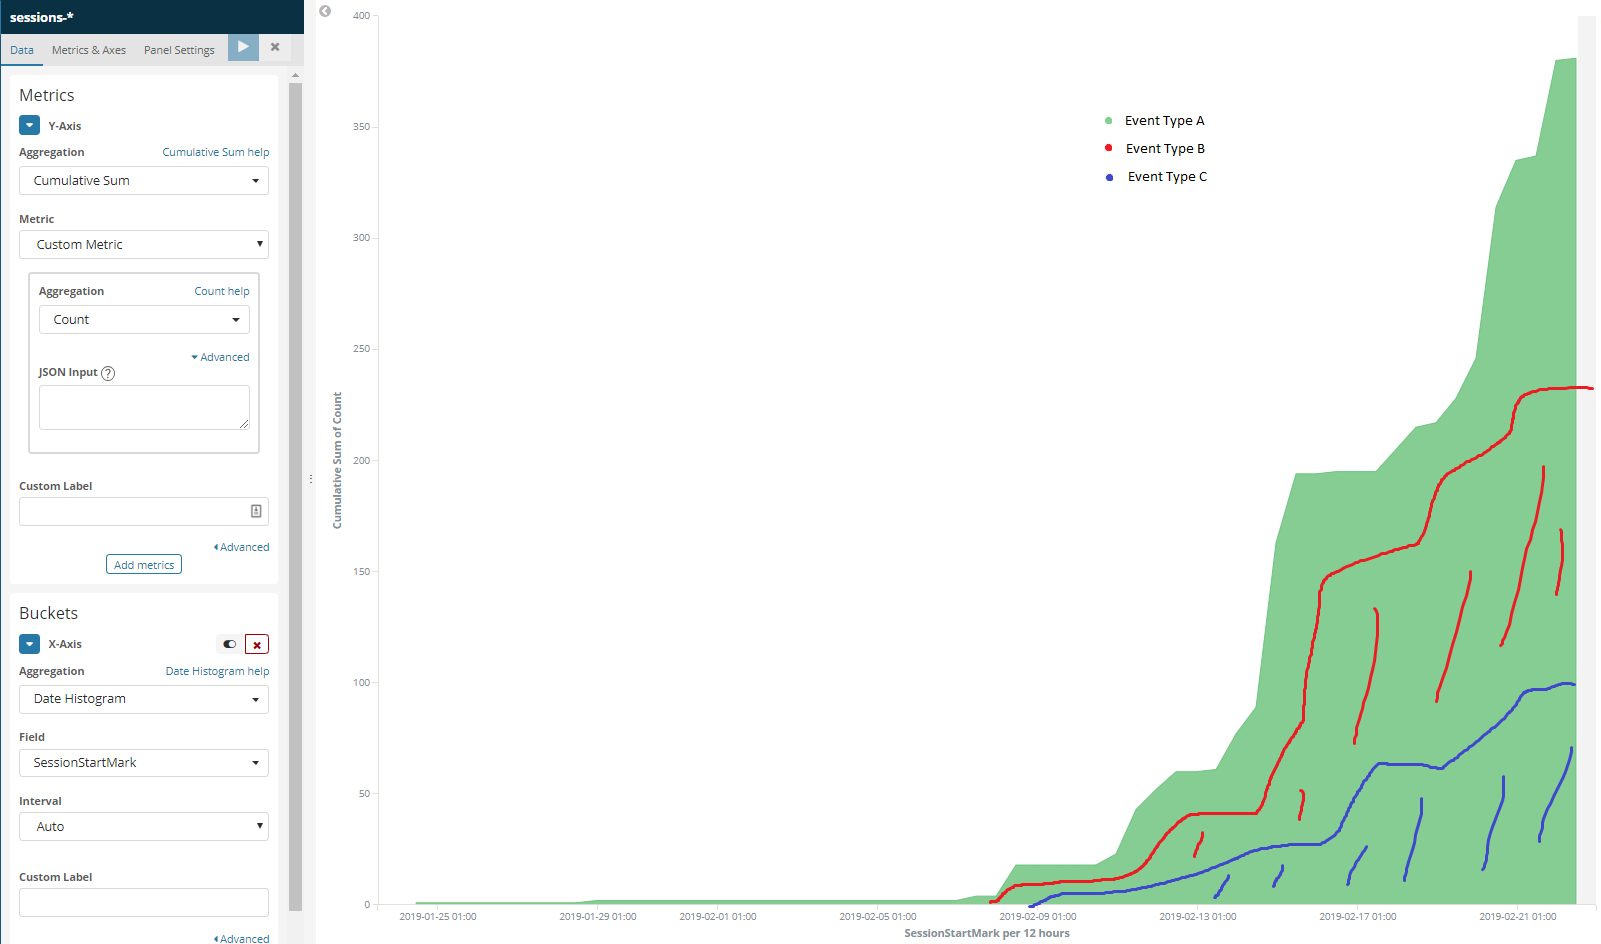
Is this something that's supported by Kibana or am I out of luck?
Was unable to find any examples showing this and all cumulative sum examples were only using a single "term" for the sum.
Thankful for any help!
Tim
---
### Author:  [@Marius\_Dragomir](https://discuss.elastic.co/u/Marius_Dragomir)
#### Post date: [February 22, 2019, 12:39pm UTC](https://discuss.elastic.co/t/creating-a-cumalative-sum-visualization-split-on-terms/169576/2 "2019-02-22T12:39:31Z")
This is something that Kibana can do. Select the Split Chart option under the X-Axis aggregation and then set it to a Terms aggregation on the field that contains the Event Type.
---
### Author:  [@DrThyme](https://discuss.elastic.co/u/DrThyme)
#### Post date: [February 22, 2019, 1:02pm UTC](https://discuss.elastic.co/t/creating-a-cumalative-sum-visualization-split-on-terms/169576/3 "2019-02-22T13:02:38Z")
Thank you a lot! I feel extremely stupid now! I never tested moving the split series to the top and was completely stumped by the "Last bucket aggregation must be "Date Histogram" or "Histogram" when using "Cumulative Sum" metric aggregation!" error I was getting when I tried that, of course order matters, silly me!
Once again, thanks! 🙂
---
### Author:  [@DrThyme](https://discuss.elastic.co/u/DrThyme)
#### Post date: [February 22, 2019, 1:55pm UTC](https://discuss.elastic.co/t/creating-a-cumalative-sum-visualization-split-on-terms/169576/4 "2019-02-22T13:55:37Z")
This sparked a follow-up question for me, not sure if it should be posted as a separate post or not. Posting it here for now. So Splitting the series on the type of event produce the visualization I need. However I noticed something strange. Looking at the visualization below the cumulative sum drops for certain types of events which doesn't make sense to me.

It's like if the last bucket doesn't have any values it defaults to 0 instead of the previous cumulative sum from the last bucket.
Zooming in on last 24 hours makes this even more apparent (previous image was last 30 days)

Is there anyway to get around this or is it intended behavior?
---
### Author:  [@Marius\_Dragomir](https://discuss.elastic.co/u/Marius_Dragomir)
#### Post date: [February 22, 2019, 2:52pm UTC](https://discuss.elastic.co/t/creating-a-cumalative-sum-visualization-split-on-terms/169576/5 "2019-02-22T14:52:01Z")
This is basically due to the fact that closest to the recent is partial bucket that will be dropped from calculation and will be set to 0. Sadly i don't think there is a way around that for now.
---
### Author:  [@system](https://discuss.elastic.co/u/system)
#### Post date: [March 22, 2019, 2:52pm UTC](https://discuss.elastic.co/t/creating-a-cumalative-sum-visualization-split-on-terms/169576/6 "2019-03-22T14:52:02Z")
This topic was automatically closed 28 days after the last reply. New replies are no longer allowed.