# Creating a time-based chart which scales from 1y to seconds
**URL:** https://discuss.elastic.co/t/creating-a-time-based-chart-which-scales-from-1y-to-seconds/56340
**Category:** Kibana
**Created:** [July 25, 2016, 9:33pm UTC](https://discuss.elastic.co/t/creating-a-time-based-chart-which-scales-from-1y-to-seconds/56340 "2016-07-25T21:33:23Z")
**Posts on this page:** 7
**Page:** 1
### Author:  [@3ygun](https://discuss.elastic.co/u/3ygun)
#### Post date: [July 25, 2016, 9:33pm UTC](https://discuss.elastic.co/t/creating-a-time-based-chart-which-scales-from-1y-to-seconds/56340/1 "2016-07-25T21:33:23Z")
# Resolved - 8/3/2016
Used a bar chart instead of line chart (see below)
Why?
- Same functionality
- Avoids the fact that lines need more than 1 data point (geometry ☹) bars do not 😄
* * *
# Original Question
I'm wondering if it is possible to modify the Time-Filter selector from within a visualization on a dashboard?

The reason I need this is because I want to start with this visualization (1 year zoom) Each line is a pcap file with a number of time stamped packets:
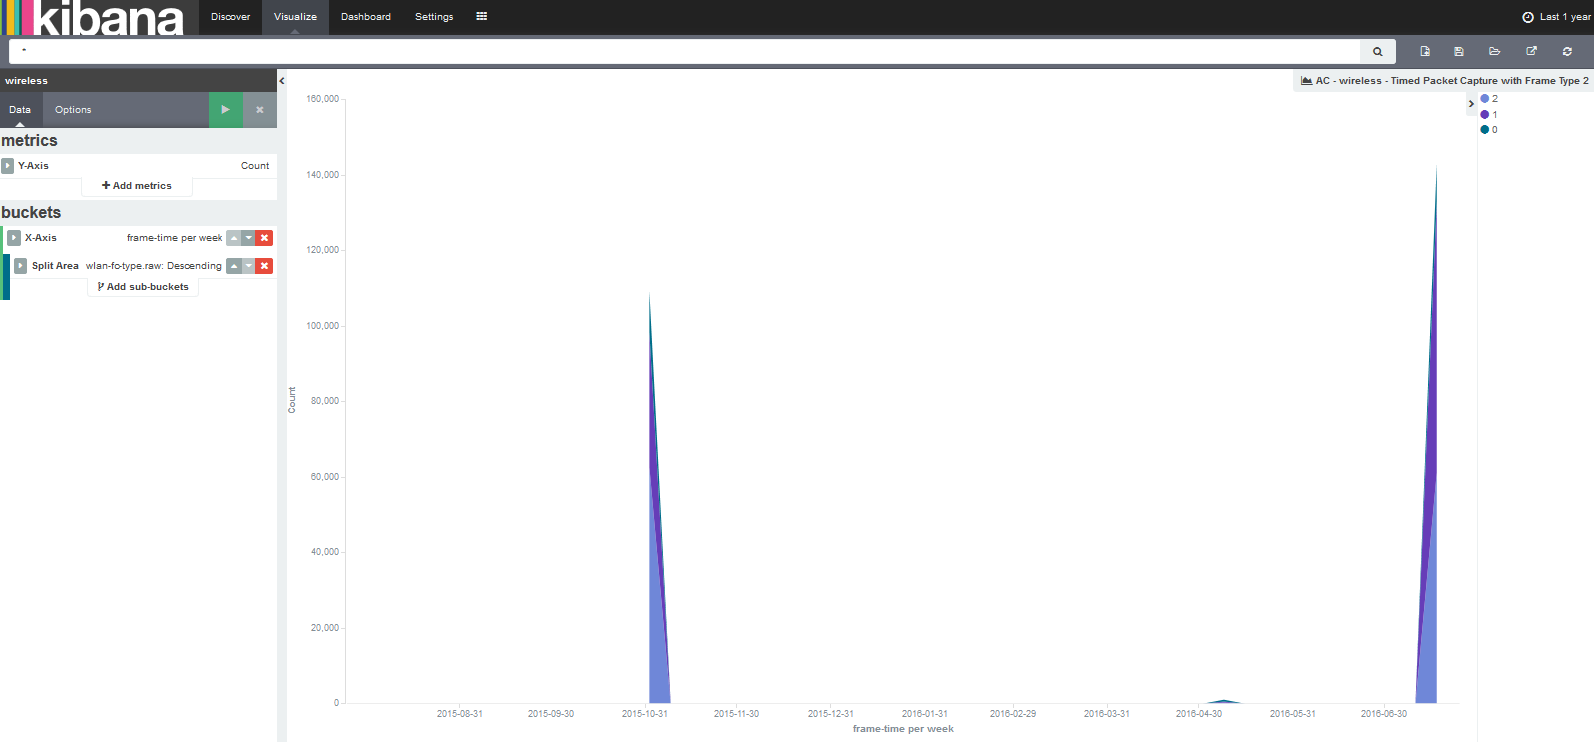
And zoom into the view of the packets (a 5 second time span):

Notice I cannot do this with the click and drag as I get this terrible screen in-between zooms. Is there anyway to disable this screen and have it just show the 1 data point until I zoom in further?

^ That is zoomed into the day but it's not split on the second yet so it only shows one data point ☹
Kibana 4.5.3
---
### Author:  [@tsullivan](https://discuss.elastic.co/u/tsullivan)
#### Post date: [July 25, 2016, 10:31pm UTC](https://discuss.elastic.co/t/creating-a-time-based-chart-which-scales-from-1y-to-seconds/56340/2 "2016-07-25T22:31:51Z")
If you click the Save icon for your Dashboard, there is a checkbox that allows you to store the time along with the saved dashboard:
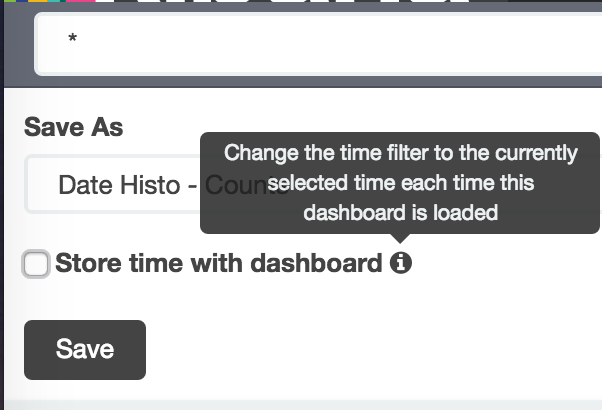
Is that pretty much what you are looking for?
---
### Author:  [@3ygun](https://discuss.elastic.co/u/3ygun)
#### Post date: [July 25, 2016, 10:38pm UTC](https://discuss.elastic.co/t/creating-a-time-based-chart-which-scales-from-1y-to-seconds/56340/3 "2016-07-25T22:38:47Z")
Sadly no. I want to allow a single dashboard to display all uploaded files. Then allow the user to filter to there specific file. Which means that all dashboard times must be dynamic not relative.
Example: It's 7-25-2016 \>\> User uploads a pcap file from 5-31-2016 \>\> The file involves 5 seconds of packet capture between 12:31:30 & 12:31:35 \>\> The chart must dynamically show these 5 seconds or allow the user to select these 5 seconds
---
### Author:  [@3ygun](https://discuss.elastic.co/u/3ygun)
#### Post date: [July 25, 2016, 11:34pm UTC](https://discuss.elastic.co/t/creating-a-time-based-chart-which-scales-from-1y-to-seconds/56340/4 "2016-07-25T23:34:44Z")
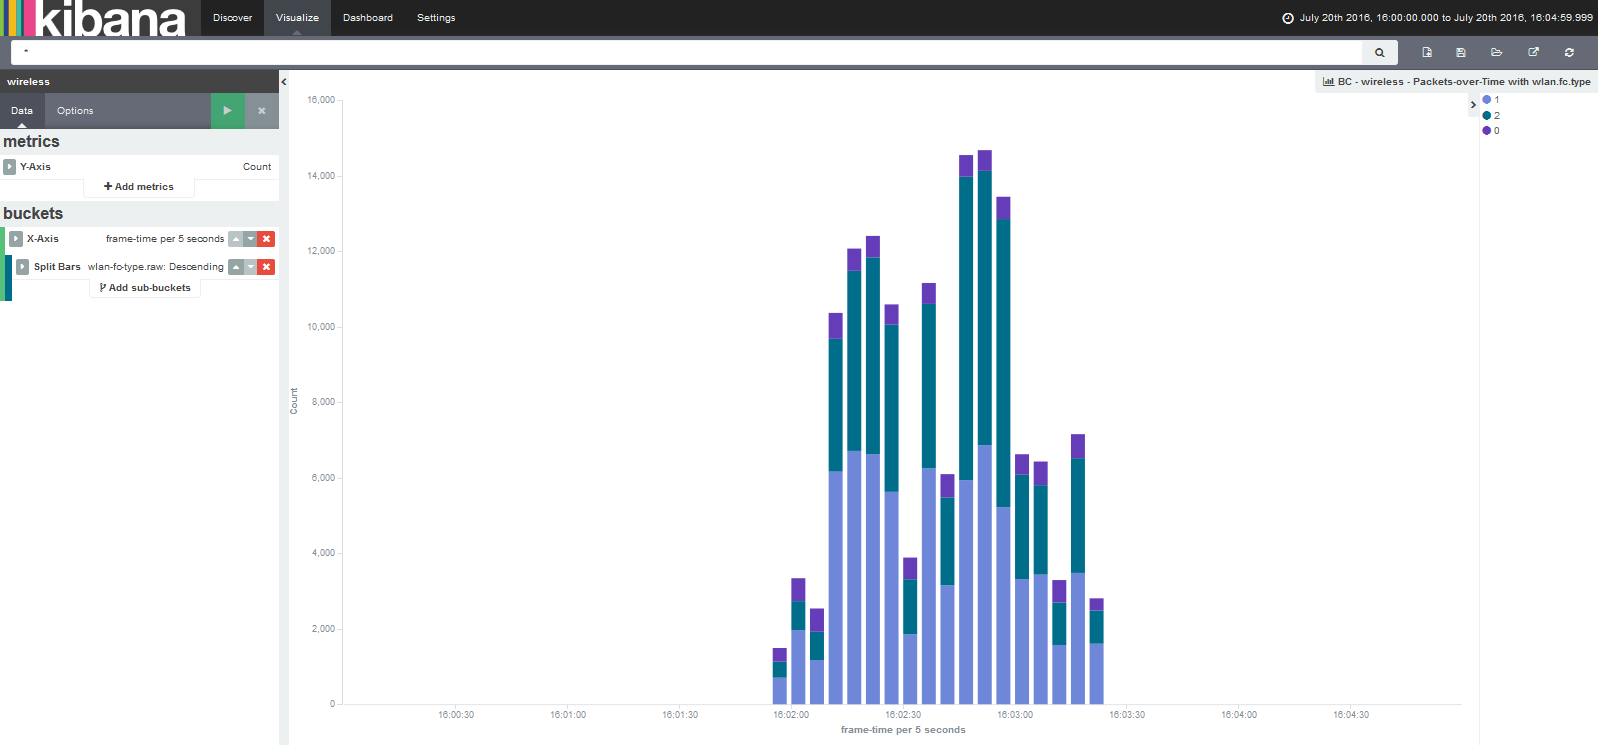
Resolved by moving to a bar chart which doesn't need \>1 data point 😕 (I know a line needs 2 points but it's still dumb)
Then the user can use the click and drag zoom in Kibana to further investigate the chart. Resulting chart:
---
### Author:  [@tsullivan](https://discuss.elastic.co/u/tsullivan)
#### Post date: [July 25, 2016, 11:53pm UTC](https://discuss.elastic.co/t/creating-a-time-based-chart-which-scales-from-1y-to-seconds/56340/5 "2016-07-25T23:53:01Z")
Ah, ok. So the issue was specific to a line chart.
---
### Author:  [@3ygun](https://discuss.elastic.co/u/3ygun)
#### Post date: [July 25, 2016, 11:54pm UTC](https://discuss.elastic.co/t/creating-a-time-based-chart-which-scales-from-1y-to-seconds/56340/6 "2016-07-25T23:54:16Z")
Yup, thanks for the help!
---
### Author:  [@system](https://discuss.elastic.co/u/system)
#### Post date: [July 6, 2017, 1:44pm UTC](https://discuss.elastic.co/t/creating-a-time-based-chart-which-scales-from-1y-to-seconds/56340/7 "2017-07-06T13:44:05Z")