# Custom clickable vizualization elements to show more detail
**URL:** https://discuss.elastic.co/t/custom-clickable-vizualization-elements-to-show-more-detail/33875
**Category:** Kibana
**Created:** [November 5, 2015, 1:44pm UTC](https://discuss.elastic.co/t/custom-clickable-vizualization-elements-to-show-more-detail/33875 "2015-11-05T13:44:05Z")
**Posts on this page:** 4
**Page:** 1
### Author:  [@iflo](https://discuss.elastic.co/u/iflo)
#### Post date: [November 5, 2015, 1:44pm UTC](https://discuss.elastic.co/t/custom-clickable-vizualization-elements-to-show-more-detail/33875/1 "2015-11-05T13:44:05Z")
Hi, I wish to use Kibana for UTM Firewall vizualization/analysis, the question is whether it's possible to assign clickable actions to the elements of the vizualization to see more detail for that particular element.
For example, I have a list/table of identified applications on the network along with parameters like consumed bandwidth etc. and I see that application "bittorrent" is consuming a lot of traffic. I want to be able to click on the "bittorrent" text and be presented with another "view", table or dashboard that shows me which users are using that particular app, what bandwidth they're consuming and so on.
In essence I want to be able to create a filter "on the fly" based on a template of kind and apply it to another dashboard.
I hope I'm being clear enough about my intentions, is this kind of application in the intended use cases of Kibana?
Thanks
---
### Author:  [@tbragin](https://discuss.elastic.co/u/tbragin)
#### Post date: [November 6, 2015, 4:56am UTC](https://discuss.elastic.co/t/custom-clickable-vizualization-elements-to-show-more-detail/33875/2 "2015-11-06T04:56:31Z")
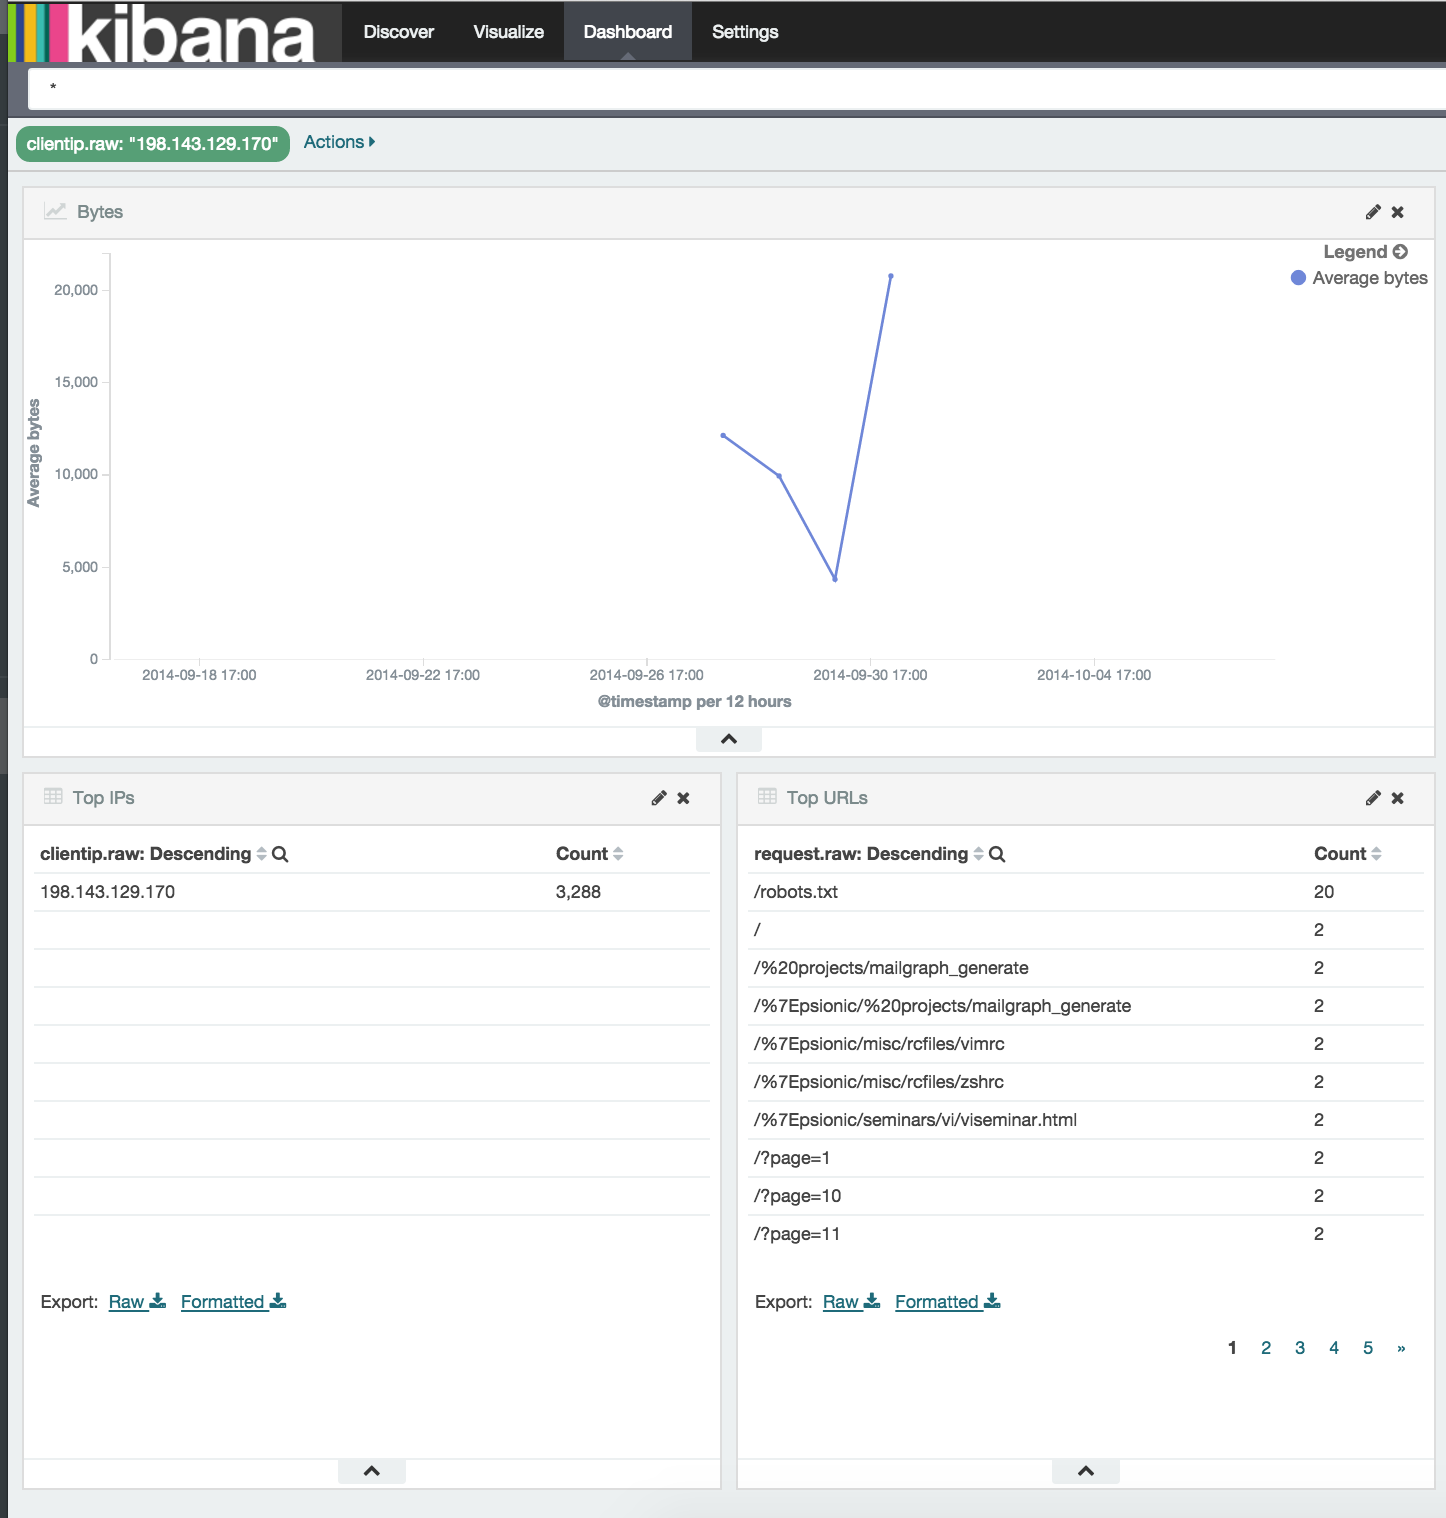
I think I understand your use case. There is no custom navigation in Kibana, but you can do the sort of filtering you describe on a single dashboard. For instance, the dashboard below shows a table for top IPs, top URLs, and bytes. When you select a single IP, the rest of the dashboard is filtered to show only the bytes and URLs that that one IP accessed.

---
### Author:  [@iflo](https://discuss.elastic.co/u/iflo)
#### Post date: [November 9, 2015, 7:31am UTC](https://discuss.elastic.co/t/custom-clickable-vizualization-elements-to-show-more-detail/33875/3 "2015-11-09T07:31:00Z")
Thanks, that partially helps, however the ability to have custom navigation would be much more useful and user-friendly, do you think it would make sense to make a feature request? I imagine, this would be be a widely welcome and useful feature.
---
### Author:  [@system](https://discuss.elastic.co/u/system)
#### Post date: [July 6, 2017, 2:09pm UTC](https://discuss.elastic.co/t/custom-clickable-vizualization-elements-to-show-more-detail/33875/4 "2017-07-06T14:09:32Z")