# Elastic Agent defunct on fleet server and clients
**URL:** https://discuss.elastic.co/t/elastic-agent-defunct-on-fleet-server-and-clients/305803
**Category:** Endpoint Security
**Tags:** elastic-agent
**Created:** [May 27, 2022, 1:18pm UTC](https://discuss.elastic.co/t/elastic-agent-defunct-on-fleet-server-and-clients/305803 "2022-05-27T13:18:15Z")
**Posts on this page:** 20
**Page:** 1
### Author:  [@francescouk](https://discuss.elastic.co/u/francescouk)
#### Post date: [May 27, 2022, 1:18pm UTC](https://discuss.elastic.co/t/elastic-agent-defunct-on-fleet-server-and-clients/305803/1 "2022-05-27T13:18:15Z")
Hello there,
I have installed elastic-agent on a ubuntu-server box and when I list which process is running I get this:

And then I realized that I got the same on the fleet server:

This doesn´t look normal.
Elastic version on both servers:
```auto
Binary: 8.2.1 (build: 40ea6cb697bcb76375527092a19d7413bfa00f3f at 2022-05-19 19:19:07 +0000 UTC)
Daemon: 8.2.1 (build: 40ea6cb697bcb76375527092a19d7413bfa00f3f at 2022-05-19 19:19:07 +0000 UTC)
```
Thanks for the attention.
---
### Author:  [@MichelLaterman](https://discuss.elastic.co/u/MichelLaterman)
#### Post date: [May 30, 2022, 4:49pm UTC](https://discuss.elastic.co/t/elastic-agent-defunct-on-fleet-server-and-clients/305803/2 "2022-05-30T16:49:31Z")
Was this directly after an install? The installation command starts another instance of `elastic-agent` that will run and gather data.
---
### Author:  [@francescouk](https://discuss.elastic.co/u/francescouk)
#### Post date: [May 30, 2022, 4:52pm UTC](https://discuss.elastic.co/t/elastic-agent-defunct-on-fleet-server-and-clients/305803/3 "2022-05-30T16:52:07Z")
Yes!!! Actually I´ve done another install in a new box and the results was the same.
---
### Author:  [@francescouk](https://discuss.elastic.co/u/francescouk)
#### Post date: [May 30, 2022, 4:56pm UTC](https://discuss.elastic.co/t/elastic-agent-defunct-on-fleet-server-and-clients/305803/4 "2022-05-30T16:56:46Z")
Just checked again:
Fleet server:

Client server:

---
### Author:  [@MichelLaterman](https://discuss.elastic.co/u/MichelLaterman)
#### Post date: [May 30, 2022, 5:11pm UTC](https://discuss.elastic.co/t/elastic-agent-defunct-on-fleet-server-and-clients/305803/5 "2022-05-30T17:11:59Z")
It's expected behaviour due to the install process. If you take a look in Kibana you should see all your agents there.
---
### Author:  [@francescouk](https://discuss.elastic.co/u/francescouk)
#### Post date: [May 30, 2022, 5:17pm UTC](https://discuss.elastic.co/t/elastic-agent-defunct-on-fleet-server-and-clients/305803/6 "2022-05-30T17:17:51Z")
Indeed. The problem is that there´s no logs coming through.
I´m integrating misp using the elastic-agent but no luck...
---
### Author:  [@MichelLaterman](https://discuss.elastic.co/u/MichelLaterman)
#### Post date: [May 30, 2022, 5:30pm UTC](https://discuss.elastic.co/t/elastic-agent-defunct-on-fleet-server-and-clients/305803/7 "2022-05-30T17:30:56Z")
You are able to see the agents, but no logs?
Is there a proxy between the agents and Elasticsearch?
---
### Author:  [@francescouk](https://discuss.elastic.co/u/francescouk)
#### Post date: [May 30, 2022, 5:32pm UTC](https://discuss.elastic.co/t/elastic-agent-defunct-on-fleet-server-and-clients/305803/8 "2022-05-30T17:32:29Z")
Nope. No proxy. Same network
---
### Author:  [@francescouk](https://discuss.elastic.co/u/francescouk)
#### Post date: [May 30, 2022, 5:50pm UTC](https://discuss.elastic.co/t/elastic-agent-defunct-on-fleet-server-and-clients/305803/9 "2022-05-30T17:50:56Z")
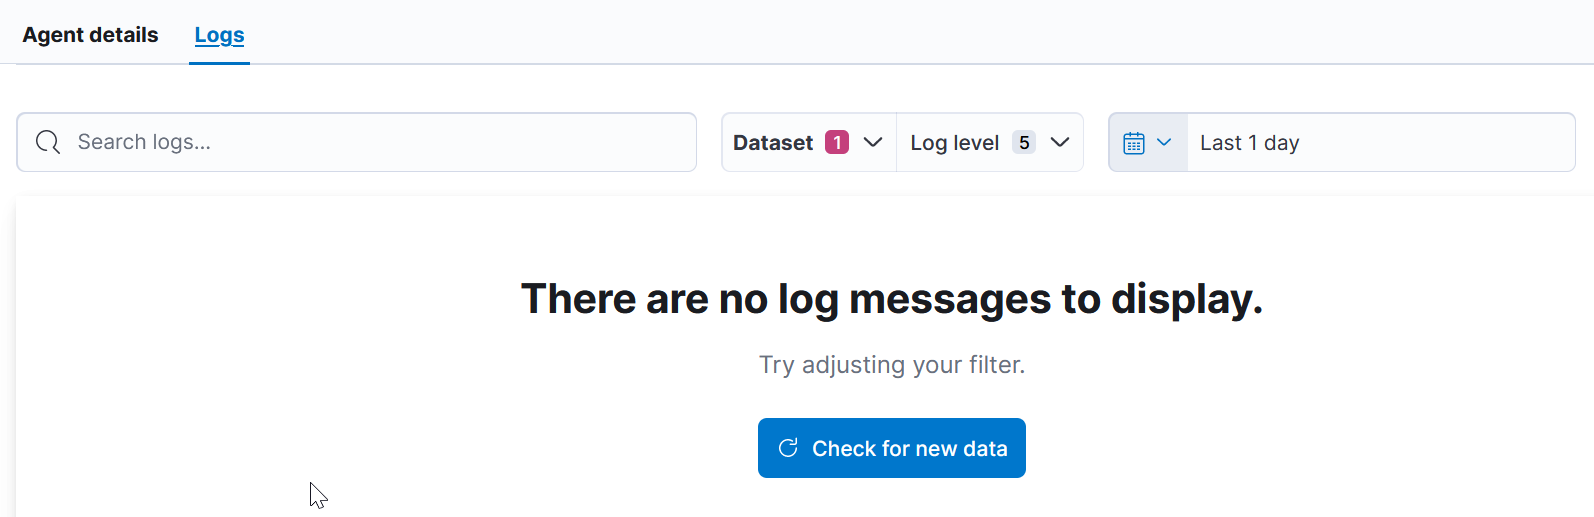
This what I can see:

And this is the log page from the agent selected:
---
### Author:  [@MichelLaterman](https://discuss.elastic.co/u/MichelLaterman)
#### Post date: [May 30, 2022, 5:51pm UTC](https://discuss.elastic.co/t/elastic-agent-defunct-on-fleet-server-and-clients/305803/10 "2022-05-30T17:51:22Z")
Can you provide a diagnostics bundle from an effected agent? via `elastic-agent diagnostics collect`?
---
### Author:  [@francescouk](https://discuss.elastic.co/u/francescouk)
#### Post date: [May 30, 2022, 6:26pm UTC](https://discuss.elastic.co/t/elastic-agent-defunct-on-fleet-server-and-clients/305803/11 "2022-05-30T18:26:21Z")
Of course. The only problem I can see is that I cannot upload zip files, only images.
---
### Author:  [@warkolm](https://discuss.elastic.co/u/warkolm)
#### Post date: [May 31, 2022, 12:58am UTC](https://discuss.elastic.co/t/elastic-agent-defunct-on-fleet-server-and-clients/305803/12 "2022-05-31T00:58:35Z")
@francescouk please don't post pictures of text, logs or code. They are difficult to read, impossible to search and replicate (if it's code), and some people may not be even able to see them 🙂
You will need to store the diagnostics elsewhere and link to them here.
---
### Author:  [@francescouk](https://discuss.elastic.co/u/francescouk)
#### Post date: [May 31, 2022, 12:59am UTC](https://discuss.elastic.co/t/elastic-agent-defunct-on-fleet-server-and-clients/305803/13 "2022-05-31T00:59:10Z")
That´s perfect. Ill do right now
---
### Author:  [@francescouk](https://discuss.elastic.co/u/francescouk)
#### Post date: [May 31, 2022, 1:17am UTC](https://discuss.elastic.co/t/elastic-agent-defunct-on-fleet-server-and-clients/305803/14 "2022-05-31T01:17:31Z")
Hi there,
Follow the shared link with elastic-agent diagnostics.
> **[elastic-agent-diagnostics-2022-05-30T18-21-23Z-00.zip](https://drive.google.com/file/d/1nE-RtGuOWiA1eooQ6OACAvqxsZlNjg4E/view?usp=sharing)**
>
> Google Drive file.
Thanks
---
### Author:  [@Guncixx](https://discuss.elastic.co/u/Guncixx)
#### Post date: [May 31, 2022, 11:49am UTC](https://discuss.elastic.co/t/elastic-agent-defunct-on-fleet-server-and-clients/305803/15 "2022-05-31T11:49:40Z")
Those are agent logs. Do you have them enabled in agent configuration even? Also you can click on dataset and see logs from filebeat etc, to see if it's collecting data or if there is any error. To see misp logs itself go to security - events section or to Discover.
---
### Author:  [@francescouk](https://discuss.elastic.co/u/francescouk)
#### Post date: [May 31, 2022, 11:58am UTC](https://discuss.elastic.co/t/elastic-agent-defunct-on-fleet-server-and-clients/305803/16 "2022-05-31T11:58:02Z")
Hi there,
No logs at all. Only from windows servers. I´ve done a tcpdump to see if there´s comunication between the linux server to fleet server and I can see that exists.
But if I go directly to the dataset from this server(linux) it´s shows no log.
I found the filebeat dataset:
```auto
08:47:03.588
elastic_agent.filebeat
[elastic_agent.filebeat][info] Non-zero metrics in the last 30s
08:47:33.588
elastic_agent.filebeat
[elastic_agent.filebeat][info] Non-zero metrics in the last 30s
08:47:50.159
elastic_agent.filebeat
[elastic_agent.filebeat][info] File is inactive. Closing because close_inactive of 5m0s reached.
08:48:03.588
elastic_agent.filebeat
[elastic_agent.filebeat][info] Non-zero metrics in the last 30s
08:48:33.588
elastic_agent.filebeat
[elastic_agent.filebeat][info] Non-zero metrics in the last 30s
08:48:53.651
elastic_agent.filebeat
[elastic_agent.filebeat][error] request failed
08:49:03.588
elastic_agent.filebeat
[elastic_agent.filebeat][info] Non-zero metrics in the last 30s
08:49:33.588
elastic_agent.filebeat
[elastic_agent.filebeat][info] Non-zero metrics in the last 30s
08:50:03.588
elastic_agent.filebeat
[elastic_agent.filebeat][info] Non-zero metrics in the last 30s
```
Also from metricbeat:
```auto
08:51:34.112
elastic_agent.metricbeat
[elastic_agent.metricbeat][info] Non-zero metrics in the last 30s
08:52:04.111
elastic_agent.metricbeat
[elastic_agent.metricbeat][info] Non-zero metrics in the last 30s
08:52:34.111
elastic_agent.metricbeat
[elastic_agent.metricbeat][info] Non-zero metrics in the last 30s
08:53:04.111
elastic_agent.metricbeat
[elastic_agent.metricbeat][info] Non-zero metrics in the last 30s
08:53:34.111
elastic_agent.metricbeat
[elastic_agent.metricbeat][info] Non-zero metrics in the last 30s
08:54:04.112
elastic_agent.metricbeat
[elastic_agent.metricbeat][info] Non-zero metrics in the last 30s
08:54:04.112
elastic_agent.metricbeat
[elastic_agent.metricbeat][info] Non-zero metrics in the last 30s
```
That´s all
---
### Author:  [@MichelLaterman](https://discuss.elastic.co/u/MichelLaterman)
#### Post date: [May 31, 2022, 4:00pm UTC](https://discuss.elastic.co/t/elastic-agent-defunct-on-fleet-server-and-clients/305803/17 "2022-05-31T16:00:19Z")
Very strange,
The logs in the diagnostics you provide show that the agent is unable to check in with fleet, it's either timing out or returning 400 responses:
```auto
{"log.level":"error","@timestamp":"2022-05-26T15:38:22.673Z","log.origin":{"file.name":"fleet/fleet_gateway.go","file.line":206},"message":"Could not communicate with fleet-server Checking API will retry, error: status code: 400, fleet-server returned an error: BadRequest","ecs.version":"1.6.0"}
...
{"log.level":"error","@timestamp":"2022-05-27T00:28:55.986Z","log.origin":{"file.name":"fleet/fleet_gateway.go","file.line":206},"message":"Could not communicate with fleet-server Checking API will retry, error: fail to checkin to fleet-server: Post \"https://XX.XX.XX.XX:8220/api/fleet/agents/0abf252d-1e5e-4312-a24c-ee9fdacdedd8/checkin?\": EOF","ecs.version":"1.6.0"}
{"log.level":"error","@timestamp":"2022-05-27T00:31:09.504Z","log.origin":{"file.name":"fleet/fleet_gateway.go","file.line":206},"message":"Could not communicate with fleet-server Checking API will retry, error: fail to checkin to fleet-server: Post \"https://XX.XX.XX.XX:8220/api/fleet/agents/0abf252d-1e5e-4312-a24c-ee9fdacdedd8/checkin?\": dial tcp XX.XX.XX.XX:8220: connect: no route to host","ecs.version":"1.6.0"}
```
I'm not sure what's causing this, it would be part of the fleet-server logs (if you want to check).
Your filebeat logs are also indicating timeout issues:
```auto
{"log.level":"error","@timestamp":"2022-05-30T09:48:51.525-0300","log.logger":"input.httpjson-cursor.retryablehttp","log.origin":{"file.name":"go-retryablehttp@v0.6.6/client.go","file.line":553},"message":"request failed","service.name":"filebeat","id":"httpjson-ti_misp.threat-020bdbd9-5a36-43b3-95c6-85b5b7d3392f","input_source":"https://XX.XX.XX.XX/events/restSearch","input_url":"https://XX.XX.XX.XX/events/restSearch","error":{"message":"Post \"https://XX.XX.XX.XX/events/restSearch\": net/http: request canceled (Client.Timeout exceeded while awaiting headers)"},"method":"POST","url":"https://XX.XX.XX.XX/events/restSearch","ecs.version":"1.6.0"}
```
You've also mentioned that you have deployed to Windows machines, however your config has a unix path for the CA cert; we don't support mixing unix and windows filepaths in the config, you should inline the CA instead.
---
### Author:  [@francescouk](https://discuss.elastic.co/u/francescouk)
#### Post date: [May 31, 2022, 4:12pm UTC](https://discuss.elastic.co/t/elastic-agent-defunct-on-fleet-server-and-clients/305803/18 "2022-05-31T16:12:25Z")
No, what I said was that was receiving logs from the windows server boxes but not from linux machines, so there´s no mixing about the config.
About the fleet server, what exactly I need to check? Which logs?
---
### Author:  [@francescouk](https://discuss.elastic.co/u/francescouk)
#### Post date: [May 31, 2022, 4:28pm UTC](https://discuss.elastic.co/t/elastic-agent-defunct-on-fleet-server-and-clients/305803/19 "2022-05-31T16:28:52Z")
So far, the logs I can see on the fleet server which dosent look normal is:
```auto
{"log.level":"error","@timestamp":"2022-05-27T09:52:14.579-0300","log.origin":{"file.name":"fleet/fleet_gateway.go","file.line":206},"message":"Could not communicate with fleet-server Checking API will retry, error: status code: 400, fleet-server returned an error: BadRequest","ecs.version":"1.6.0"}
{"log.level":"error","@timestamp":"2022-05-27T12:40:51.739-0300","log.origin":{"file.name":"fleet/fleet_gateway.go","file.line":206},"message":"Could not communicate with fleet-server Checking API will retry, error: status code: 400, fleet-server returned an error: BadRequest","ecs.version":"1.6.0"}
{"log.level":"error","@timestamp":"2022-05-28T18:10:37.712-0300","log.origin":{"file.name":"fleet/fleet_gateway.go","file.line":206},"message":"Could not communicate with fleet-server Checking API will retry, error: status code: 400, fleet-server returned an error: BadRequest","ecs.version":"1.6.0"}
```
And this one:
```auto
{"log.level":"error","@timestamp":"2022-05-24T23:24:19.440-0300","log.origin":{"file.name":"process/app.go","file.line":290},"message":"failed to stop fleet-server: os: process already finished","ecs.version":"1.6.0"}
{"log.level":"error","@timestamp":"2022-05-26T20:53:26.475-0300","log.origin":{"file.name":"log/reporter.go","file.line":36},"message":"2022-05-26T20:53:26-03:00 - message: Application: filebeat--8.2.1--36643631373035623733363936343635[cc0e4a76-f1fb-4b7c-8b6e-5ac8857355c6]: State changed to FAILED: failed to stop after 30s: application stopping timed out - type: 'ERROR' - sub_type: 'FAILED'","ecs.version":"1.6.0"}
{"log.level":"error","@timestamp":"2022-05-26T20:53:26.475-0300","log.origin":{"file.name":"process/app.go","file.line":158},"message":"failed to stop after 30s: application stopping timed out","ecs.version":"1.6.0"}
{"log.level":"error","@timestamp":"2022-05-26T20:53:26.475-0300","log.origin":{"file.name":"process/app.go","file.line":290},"message":"failed to stop fleet-server: os: process already finished","ecs.version":"1.6.0"}
{"log.level":"error","@timestamp":"2022-05-26T21:29:28.652-0300","log.origin":{"file.name":"process/app.go","file.line":158},"message":"failed to stop after 30s: application stopping timed out","ecs.version":"1.6.0"}
{"log.level":"error","@timestamp":"2022-05-26T21:29:28.652-0300","log.origin":{"file.name":"process/app.go","file.line":290},"message":"failed to stop fleet-server: os: process already finished","ecs.version":"1.6.0"}
{"log.level":"error","@timestamp":"2022-05-26T21:29:28.652-0300","log.origin":{"file.name":"log/reporter.go","file.line":36},"message":"2022-05-26T21:29:28-03:00 - message: Application: fleet-server--8.2.1[cc0e4a76-f1fb-4b7c-8b6e-5ac8857355c6]: State changed to FAILED: failed to stop after 30s: application stopping timed out - type: 'ERROR' - sub_type: 'FAILED'","ecs.version":"1.6.0"}
```
---
### Author:  [@francescouk](https://discuss.elastic.co/u/francescouk)
#### Post date: [June 1, 2022, 12:28pm UTC](https://discuss.elastic.co/t/elastic-agent-defunct-on-fleet-server-and-clients/305803/20 "2022-06-01T12:28:51Z")
I have installed a new linux ubuntu server with misp and still the same error. My question is, does it really work this misp integration with Elasticsearch???
As soon as I connected to this box, the first message that appears:
```auto
=> There are 2 zombie processes.
```
And then check the status:
```auto
administrator@misp:~$ ps axo stat,ppid,pid,comm | grep -w defunct
Zs 12479 12511 elastic-agent
Zs 12479 12702 elastic-agent
```
I really dont know if this is normal behaviour....
[Next page](https://discuss.elastic.co/t/elastic-agent-defunct-on-fleet-server-and-clients/305803.md?page=2)