### Author:  [@no\_jihun](https://discuss.elastic.co/u/no_jihun)
#### Post date: [May 4, 2016, 5:49am UTC](https://discuss.elastic.co/t/elasticsearch-5-0-0-alpha2-nodenodeavailableexception/49125/1 "2016-05-04T05:49:35Z")
Hi.
I got this error when using JavaClient+Elasticsearch(both version of them are 5.0.0alpha2)
Today morning I upgraded clinet/Server from alpha1 to alpha2.
This did not happen in 5.0.0 alpha1 I think.
#### client code and error log
```auto
client = builder.build() //
.addTransportAddress(new InetSocketTransportAddress(InetAddress.getByName("10.99.220.112"), 9300))
.addTransportAddress(new InetSocketTransportAddress(InetAddress.getByName("10.99.205.171"), 9300))
.addTransportAddress(new InetSocketTransportAddress(InetAddress.getByName("10.99.213.10"), 9300))
.addTransportAddress(new InetSocketTransportAddress(InetAddress.getByName("10.113.187.68"), 9300));
SearchRequestBuilder srb = client.prepareSearch();
srb.setIndices(targetIndices);
srb.setTypes(request.getServiceId());
srb.setQuery(masterQuery);
srb.addAggregation(ab);
srb.setSize(0);
ListenableActionFuture execute = srb.execute(); <--- this line claims..
NoNodeAvailableException[None of the configured nodes were available: [{dev-elastic204.ncl}{LKNBLbPRRLC6S-jN-5XJKQ}{10.113.187.68}{10.113.187.68:9300}, {dev-elastic202.ncl}{zi7dPFrWS3OyW-jZB5O6Dg}{10.99.205.171}{10.99.205.171:9300}, {dev-elastic201.ncl}{Vf60NeajSmyH82ZteANo1Q}{10.99.220.112}{10.99.220.112:9300}, {dev-elastic203.ncl}{DD0V1VZ_RzqpkXpbbJwWwQ}{10.99.213.10}{10.99.213.10:9300}]]; nested: NodeDisconnectedException[[dev-elastic204.ncl][10.113.187.68:9300][indices:data/read/search] disconnected];
at org.elasticsearch.client.transport.TransportClientNodesService$RetryListener.onFailure(TransportClientNodesService.java:253)
....
at java.lang.Thread.run(Thread.java:745)
Caused by: NodeDisconnectedException[[dev-elastic204.ncl][10.113.187.68:9300][indices:data/read/search] disconnected]
```
#### server log
```auto
[2016-05-04 09:16:44,910][WARN][threadpool] [dev-elastic201.ncl] failed to run org.elasticsearch.watcher.ResourceWatcherService$ResourceMonitor@3e8cb932
java.security.AccessControlException: access denied ("java.io.FilePermission" "/home1/apps/elasticsearch/config/scripts" "read")
at java.security.AccessControlContext.checkPermission(AccessControlContext.java:472)
at java.security.AccessController.checkPermission(AccessController.java:884)
....
[2016-05-04 14:16:05,316][WARN][transport.netty] [dev-elastic201.ncl] exception caught on transport layer [[id: 0x6fa39b9a, /10.75.17.101:49956 => /10.99.220.112:9300]], closing connection
java.lang.IllegalStateException: Message not fully read (request) for requestId [0], action [cluster:monitor/nodes/liveness], readerIndex [52] vs expected [52]; resetting
at org.elasticsearch.transport.netty.MessageChannelHandler.messageReceived(MessageChannelHandler.java:144)
at org.jboss.netty.channel.SimpleChannelUpstreamHandler.handleUpstream(SimpleChannelUpstreamHandler.java:70)
....
at java.lang.Thread.run(Thread.java:745)
[2016-05-04 14:16:05,350][WARN][transport.netty] [dev-elastic201.ncl] exception caught on transport layer [[id: 0x5ef09158, /10.75.17.101:49971 => /10.99.220.112:9300]], closing connection
java.lang.IllegalStateException: Message not fully read (request) for requestId [1], action [cluster:monitor/nodes/liveness], readerIndex [52] vs expected [52]; resetting
at org.elasticsearch.transport.netty.MessageChannelHandler.messageReceived(MessageChannelHandler.java:144)
at org.jboss.netty.channel.SimpleChannelUpstreamHandler.handleUpstream(SimpleChannelUpstreamHandler.java:70)
```
#### /\_cluster/state
Every nodes seems ok.

#### /\_cluster/health
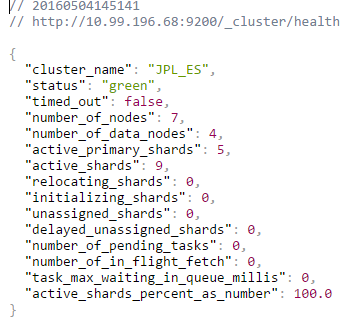
What should I check?
#### REST \_search returns the result well.

---
### Author:  [@dadoonet](https://discuss.elastic.co/u/dadoonet)
#### Post date: [May 4, 2016, 6:28am UTC](https://discuss.elastic.co/t/elasticsearch-5-0-0-alpha2-nodenodeavailableexception/49125/2 "2016-05-04T06:28:14Z")
Might be unrelated but interesting to know. Does `/home1/apps/elasticsearch/config/scripts` exists?
---
### Author:  [@no\_jihun](https://discuss.elastic.co/u/no_jihun)
#### Post date: [May 4, 2016, 6:31am UTC](https://discuss.elastic.co/t/elasticsearch-5-0-0-alpha2-nodenodeavailableexception/49125/3 "2016-05-04T06:31:22Z")
No, it is not exist there.
I run elasticsearch by this script!
```auto
#!/bin/sh
set -e
export ES_JAVA_OPTS=" -Xms4g -Xmx4g"
export ES_JAVA_OPTS=${ES_JAVA_OPTS}" -XX:-UseParNewGC -XX:-UseConcMarkSweepGC -XX:+UseG1GC"
export ES_JAVA_OPTS=${ES_JAVA_OPTS}" -XX:+PrintGCDetails -XX:+PrintGCDateStamps -XX:+PrintGCTimeStamps -Xloggc:/home1/.elasticsearch/logs/gc.log"
export ES_JAVA_OPTS=${ES_JAVA_OPTS}" -XX:+UseGCLogFileRotation -XX:NumberOfGCLogFiles=50 -XX:GCLogFileSize=1M"
export ES_NODE_OPTS=" -E es.cluster.name=JPL_ES"
export ES_NODE_OPTS=${ES_NODE_OPTS}" -E es.node.name="$HOSTNAME
export ES_NODE_OPTS=${ES_NODE_OPTS}" -E es.path.logs=/home1/.elasticsearch/logs"
export ES_NODE_OPTS=${ES_NODE_OPTS}" -E es.path.data=/home1/.elasticsearch/data"
export ES_NODE_OPTS=${ES_NODE_OPTS}" -E es.discovery.zen.ping.unicast.hosts=10.99.196.68,10.101.60.10,10.99.206.139"
export ES_NODE_OPTS=${ES_NODE_OPTS}" -E es.discovery.zen.minimum_master_nodes=2"
export ES_NODE_OPTS=${ES_NODE_OPTS}" -E es.network.host=_eth0_"
export ES_NODE_OPTS=${ES_NODE_OPTS}" -E es.http.cors.allow-origin=/.*/"
export ES_NODE_OPTS=${ES_NODE_OPTS}" -E es.http.cors.enabled=true"
export ES_NODE_OPTS=${ES_NODE_OPTS}" -E es.node.max_local_storage_nodes=1"
#export ES_NODE_OPTS=${ES_NODE_OPTS}" -E es.bootstrap.mlockall=true"
if [$1 == "master"]; then
export ES_NODE_OPTS=${ES_NODE_OPTS}" -Ees.node.master=true -Ees.node.data=false"
elif [$1 == "data"]; then
export ES_NODE_OPTS=${ES_NODE_OPTS}" -Ees.node.master=false -Ees.node.data=true"
else
echo "argument error!!"
echo "usage = "$0" [data|master]"
exit 1
fi
echo ""
echo "[Kill running elasticsearch] =============="
ps_cnt=`ps -Al | grep org.elasticsearch.bootstrap.Elasticsearch | wc -l`
if (( $ps_cnt > 0 )); then
ps -ef | grep org.elasticsearch.bootstrap.Elasticsearch | grep -v grep | awk '{print $2}' | xargs kill
fi
sleep 3
echo "[ES starting with options] =============="
echo "ES_JAVA_OPTS===="
echo $ES_JAVA_OPTS
echo ""
echo "ES_NODE_OPTS===="
echo $ES_NODE_OPTS
echo ""
/home1/apps/elasticsearch/bin/elasticsearch -d $ES_NODE_OPTS
```
---
### Author:  [@no\_jihun](https://discuss.elastic.co/u/no_jihun)
#### Post date: [May 4, 2016, 6:44am UTC](https://discuss.elastic.co/t/elasticsearch-5-0-0-alpha2-nodenodeavailableexception/49125/4 "2016-05-04T06:44:22Z")
This perhaps related or not..
```auto
/_cluster/state
```
responses within 30ms,
but
```auto
/_stats
```
Do not reponses for tens of seconds. always.

---
### Author:  [@dadoonet](https://discuss.elastic.co/u/dadoonet)
#### Post date: [May 4, 2016, 6:47am UTC](https://discuss.elastic.co/t/elasticsearch-5-0-0-alpha2-nodenodeavailableexception/49125/5 "2016-05-04T06:47:08Z")
I tried your script and adapted it a bit for my env but I did not get this `WARN`.
Not sure where your java client error comes from.
That being said, when I look at the unicast list of nodes
> `[{dev-elastic204.ncl}{LKNBLbPRRLC6S-jN-5XJKQ}{10.113.187.68}{10.113.187.68:9300}, {dev-elastic202.ncl}{zi7dPFrWS3OyW-jZB5O6Dg}{10.99.205.171}{10.99.205.171:9300}, {dev-elastic201.ncl}{Vf60NeajSmyH82ZteANo1Q}{10.99.220.112}{10.99.220.112:9300}, {dev-elastic203.ncl}{DD0V1VZ_RzqpkXpbbJwWwQ}{10.99.213.10}{10.99.213.10:9300}]]; nested: NodeDisconnectedException[[dev-elastic204.ncl][10.113.187.68:9300][indices:data/read/search] disconnected];`
And the address you are using to test the REST layer `10.99.196.68`
They are different.
Side note: please don't send screen captures.
---
### Author:  [@no\_jihun](https://discuss.elastic.co/u/no_jihun)
#### Post date: [May 4, 2016, 6:49am UTC](https://discuss.elastic.co/t/elasticsearch-5-0-0-alpha2-nodenodeavailableexception/49125/6 "2016-05-04T06:49:20Z")
This is list of dedicated master nodes,
```auto
export ES_NODE_OPTS=${ES_NODE_OPTS}" -E es.discovery.zen.ping.unicast.hosts=10.99.196.68,10.101.60.10,10.99.206.139"
```
and this is is dedicated data nodes.
```auto
.addTransportAddress(new InetSocketTransportAddress(InetAddress.getByName("10.99.220.112"), 9300))
.addTransportAddress(new InetSocketTransportAddress(InetAddress.getByName("10.99.205.171"), 9300))
.addTransportAddress(new InetSocketTransportAddress(InetAddress.getByName("10.99.213.10"), 9300))
.addTransportAddress(new InetSocketTransportAddress(InetAddress.getByName("10.113.187.68"), 9300));
```
Both of master and data node's /\_custer/state response well by REST call.
```auto
http://10.99.196.68:9200/_cluster/state
http://10.99.205.171:9200/_cluster/state
```
---
### Author:  [@dadoonet](https://discuss.elastic.co/u/dadoonet)
#### Post date: [May 4, 2016, 7:03am UTC](https://discuss.elastic.co/t/elasticsearch-5-0-0-alpha2-nodenodeavailableexception/49125/7 "2016-05-04T07:03:02Z")
Let's pick up only one node which is working.
For example: `10.99.205.171:9200`
Can you you only add this one?
```java
.addTransportAddress(new InetSocketTransportAddress(InetAddress.getByName("10.99.205.171"), 9300))
```
---
### Author:  [@no\_jihun](https://discuss.elastic.co/u/no_jihun)
#### Post date: [May 4, 2016, 7:08am UTC](https://discuss.elastic.co/t/elasticsearch-5-0-0-alpha2-nodenodeavailableexception/49125/8 "2016-05-04T07:08:51Z")
I've tried these codes but all are same result.
```auto
client = builder.build()
.addTransportAddress(new InetSocketTransportAddress(InetAddress.getByName("10.99.205.171"), 9300));
```
```auto
client = builder.build()
.addTransportAddress(new InetSocketTransportAddress(InetAddress.getByName("10.99.196.68"), 9300));
```
```auto
Caused by: NodeDisconnectedException[[dev-elastic202.ncl][10.99.205.171:9300][indices:data/read/search] disconnected]
```
---
### Author:  [@dadoonet](https://discuss.elastic.co/u/dadoonet)
#### Post date: [May 4, 2016, 7:22am UTC](https://discuss.elastic.co/t/elasticsearch-5-0-0-alpha2-nodenodeavailableexception/49125/9 "2016-05-04T07:22:09Z")
Can you reproduce it with a simple example?
I mean:
- download a clean new version of alpha2
- unzip it
- run it locally (without your script)
- create a Transport client on `127.0.0.1`
And check what is happening? I just want to make sure where we should look at next.
---
### Author:  [@no\_jihun](https://discuss.elastic.co/u/no_jihun)
#### Post date: [May 4, 2016, 8:08am UTC](https://discuss.elastic.co/t/elasticsearch-5-0-0-alpha2-nodenodeavailableexception/49125/10 "2016-05-04T08:08:11Z")
I've tried to reproduce this on a single, new installed machine, with same configuration. but couldn't.
bwt, there are indices which created with ES-5.0.0-alpha1. this could be a problem?
Anyway. Thanks a lot @dadoonet
---
### Author:  [@dadoonet](https://discuss.elastic.co/u/dadoonet)
#### Post date: [May 4, 2016, 8:22am UTC](https://discuss.elastic.co/t/elasticsearch-5-0-0-alpha2-nodenodeavailableexception/49125/11 "2016-05-04T08:22:05Z")
Could you then try to remove the data dir you were using for `alpha1`? You have to know that it will obviously remove all your data.
So we make sure it's not related?
Also could you try to make all the nodes run as master **AND** data nodes?
---
### Author:  [@no\_jihun](https://discuss.elastic.co/u/no_jihun)
#### Post date: [May 4, 2016, 10:19am UTC](https://discuss.elastic.co/t/elasticsearch-5-0-0-alpha2-nodenodeavailableexception/49125/12 "2016-05-04T10:19:38Z")
ok if I find the cause I will share here.
---
### Author:  [@no\_jihun](https://discuss.elastic.co/u/no_jihun)
#### Post date: [May 7, 2016, 12:52pm UTC](https://discuss.elastic.co/t/elasticsearch-5-0-0-alpha2-nodenodeavailableexception/49125/13 "2016-05-07T12:52:46Z")
Hello, I am again.
I figured out
- index created using alpha1 makes no problem.
I didn't tried all master+data role.
It has reproduced accidently.
1. 7 newly setup centos(6.5) machine prepared.
2. 3 for master, 4 for data.
3. unicast, zen discovery.
The only index on the cluster is '.kibana'.
It was ok and all apis responded well for a day.
But today I become wrong again.
### \_cluster/health \<-- always good(I mean It responses under 100ms)
```auto
{
"cluster_name": "elastic_jpl",
"status": "green",
"timed_out": false,
"number_of_nodes": 7,
"number_of_data_nodes": 4,
"active_primary_shards": 1,
"active_shards": 2,
"relocating_shards": 0,
"initializing_shards": 0,
"unassigned_shards": 0,
"delayed_unassigned_shards": 0,
"number_of_pending_tasks": 0,
"number_of_in_flight_fetch": 0,
"task_max_waiting_in_queue_millis": 0,
"active_shards_percent_as_number": 100.0
}
```
### /\_cluster/state , /\_nodes/hot\_threads \<--- often pending, no response, time out.
### node 3's logs
```auto
[2016-05-07 21:23:37,473][INFO][discovery.zen] [dev-jpl-elastic003.ncl] master_left [{dev-jpl-elastic001.ncl}{JrYS7A88QcO8SkbkaxxIGQ}{10.101.59.211}{10.101.59.211:9300}], reason [failed to ping, tried [3] times, each with maximum [30s] timeout]
[2016-05-07 21:23:37,477][WARN][discovery.zen] [dev-jpl-elastic003.ncl] master left (reason = failed to ping, tried [3] times, each with maximum [30s] timeout), current nodes: {{dev-jpl-elastic004.ncl}{_fuw0xoERFWMFOlXzXTpfw}{10.101.63.85}{10.101.63.85:9300},{dev-jpl-elastic003.ncl}{tIM80chxQrqmSOxlZVPWJA}{10.113.187.217}{10.113.187.217:9300},{dev-jpl-elastic005.ncl}{sDvKJItrQn2J0g9CukrLdw}{10.101.59.119}{10.101.59.119:9300},{dev-jpl-elastic002.ncl}{gNZCnp87RuWAOHvTY0F-Dw}{10.99.217.46}{10.99.217.46:9300},{dev-jpl-elastic006.ncl}{-tIIMV47TMKajCGX5eUcCg}{10.99.198.216}{10.99.198.216:9300},{dev-jpl-elastic007.ncl}{_4UB9z4zQ9unEoFbHPYivA}{10.99.215.151}{10.99.215.151:9300},}
[2016-05-07 21:23:37,479][INFO][cluster.service] [dev-jpl-elastic003.ncl] removed {{dev-jpl-elastic001.ncl}{JrYS7A88QcO8SkbkaxxIGQ}{10.101.59.211}{10.101.59.211:9300},}, reason: zen-disco-master_failed ({dev-jpl-elastic001.ncl}{JrYS7A88QcO8SkbkaxxIGQ}{10.101.59.211}{10.101.59.211:9300})
[2016-05-07 21:24:52,483][WARN][discovery.zen.ping.unicast] [dev-jpl-elastic003.ncl] failed to send ping to [{#zen_unicast_2#}{10.99.217.46}{10.99.217.46:9300}]
ReceiveTimeoutTransportException[[dev-jpl-elastic002.ncl][10.99.217.46:9300][internal:discovery/zen/unicast] request_id [86762] timed out after [75000ms]]
at org.elasticsearch.transport.TransportService$TimeoutHandler.run(TransportService.java:681)
at
[2016-05-07 21:24:52,485][WARN][discovery.zen.ping.unicast] [dev-jpl-elastic003.ncl] failed to send ping to [{dev-jpl-elastic002.ncl}{gNZCnp87RuWAOHvTY0F-Dw}{10.99.217.46}{10.99.217.46:9300}]
ReceiveTimeoutTransportException[[dev-jpl-elastic002.ncl][10.99.217.46:9300][internal:discovery/zen/unicast] request_id [86765] timed out after [75004ms]]
at org.elasticsearch.transport.TransportService$TimeoutHandler.run(TransportService.java:681)
at
[2016-05-07 21:25:07,518][INFO][cluster.service] [dev-jpl-elastic003.ncl] detected_master {dev-jpl-elastic001.ncl}{JrYS7A88QcO8SkbkaxxIGQ}{10.101.59.211}{10.101.59.211:9300}, added {{dev-jpl-elastic001.ncl}{JrYS7A88QcO8SkbkaxxIGQ}{10.101.59.211}{10.101.59.211:9300},}, reason: zen-disco-receive(from master [master {dev-jpl-elastic001.ncl}{JrYS7A88QcO8SkbkaxxIGQ}{10.101.59.211}{10.101.59.211:9300} committed version [13]])
[2016-05-07 21:25:22,482][WARN][discovery.zen.ping.unicast] [dev-jpl-elastic003.ncl] failed to send ping to [{#zen_unicast_2#}{10.99.217.46}{10.99.217.46:9300}]
ReceiveTimeoutTransportException[[dev-jpl-elastic002.ncl][10.99.217.46:9300][internal:discovery/zen/unicast] request_id [86767] timed out after [75001ms]]
[2016-05-07 21:25:22,483][WARN][discovery.zen.ping.unicast] [dev-jpl-elastic003.ncl] failed to send ping to [{dev-jpl-elastic002.ncl}{gNZCnp87RuWAOHvTY0F-Dw}{10.99.217.46}{10.99.217.46:9300}]
ReceiveTimeoutTransportException[[dev-jpl-elastic002.ncl][10.99.217.46:9300][internal:discovery/zen/unicast] request_id [86769] timed out after [75000ms]]
```
I am not sure this fail caused by network fail or server nodes's fail.
every host's [http://host:9200](http://host:9200) response well when \_cluster/state nore responses.
#### thread dump
this is a thread dump of first data node when \_cluster/stats not responses.
>
I 've read the Zen discovery's ping code but It look a little complicated
What is the endpoint of the zen's ping request?
---
### Author:  [@system](https://discuss.elastic.co/u/system)
#### Post date: [July 5, 2017, 10:53pm UTC](https://discuss.elastic.co/t/elasticsearch-5-0-0-alpha2-nodenodeavailableexception/49125/14 "2017-07-05T22:53:11Z")