# Elasticsearch basic performance
**URL:** https://discuss.elastic.co/t/elasticsearch-basic-performance/109053
**Category:** Elasticsearch
**Created:** [November 24, 2017, 4:02pm UTC](https://discuss.elastic.co/t/elasticsearch-basic-performance/109053 "2017-11-24T16:02:57Z")
**Posts on this page:** 13
**Page:** 1
### Author:  [@elastic\_paul](https://discuss.elastic.co/u/elastic_paul)
#### Post date: [November 24, 2017, 4:02pm UTC](https://discuss.elastic.co/t/elasticsearch-basic-performance/109053/1 "2017-11-24T16:02:57Z")
I have 12 servers running logstash. They are sending data to 4 ES nodes. Each ES node has 24 cores, 36TB of spinning disks and 128GB RAM. The 12 logstash machines are sending round robin to the 4 ES nodes. All going into one index, with no replication and 16 shards (4 shards per ES node). Everything has been upgraded to 6.0.
Performance is poor and nothing I can do seems to change anything.
For example here is a snapshot of the thread pool:
```auto
hdp15 bulk 25 270 18912
hdp16 bulk 25 201 22420
hdp13 bulk 25 278 29157
hdp14 bulk 25 560 16598
```
Queue is set to 600 but there are lots of rejects so the ES nodes can not keep up.
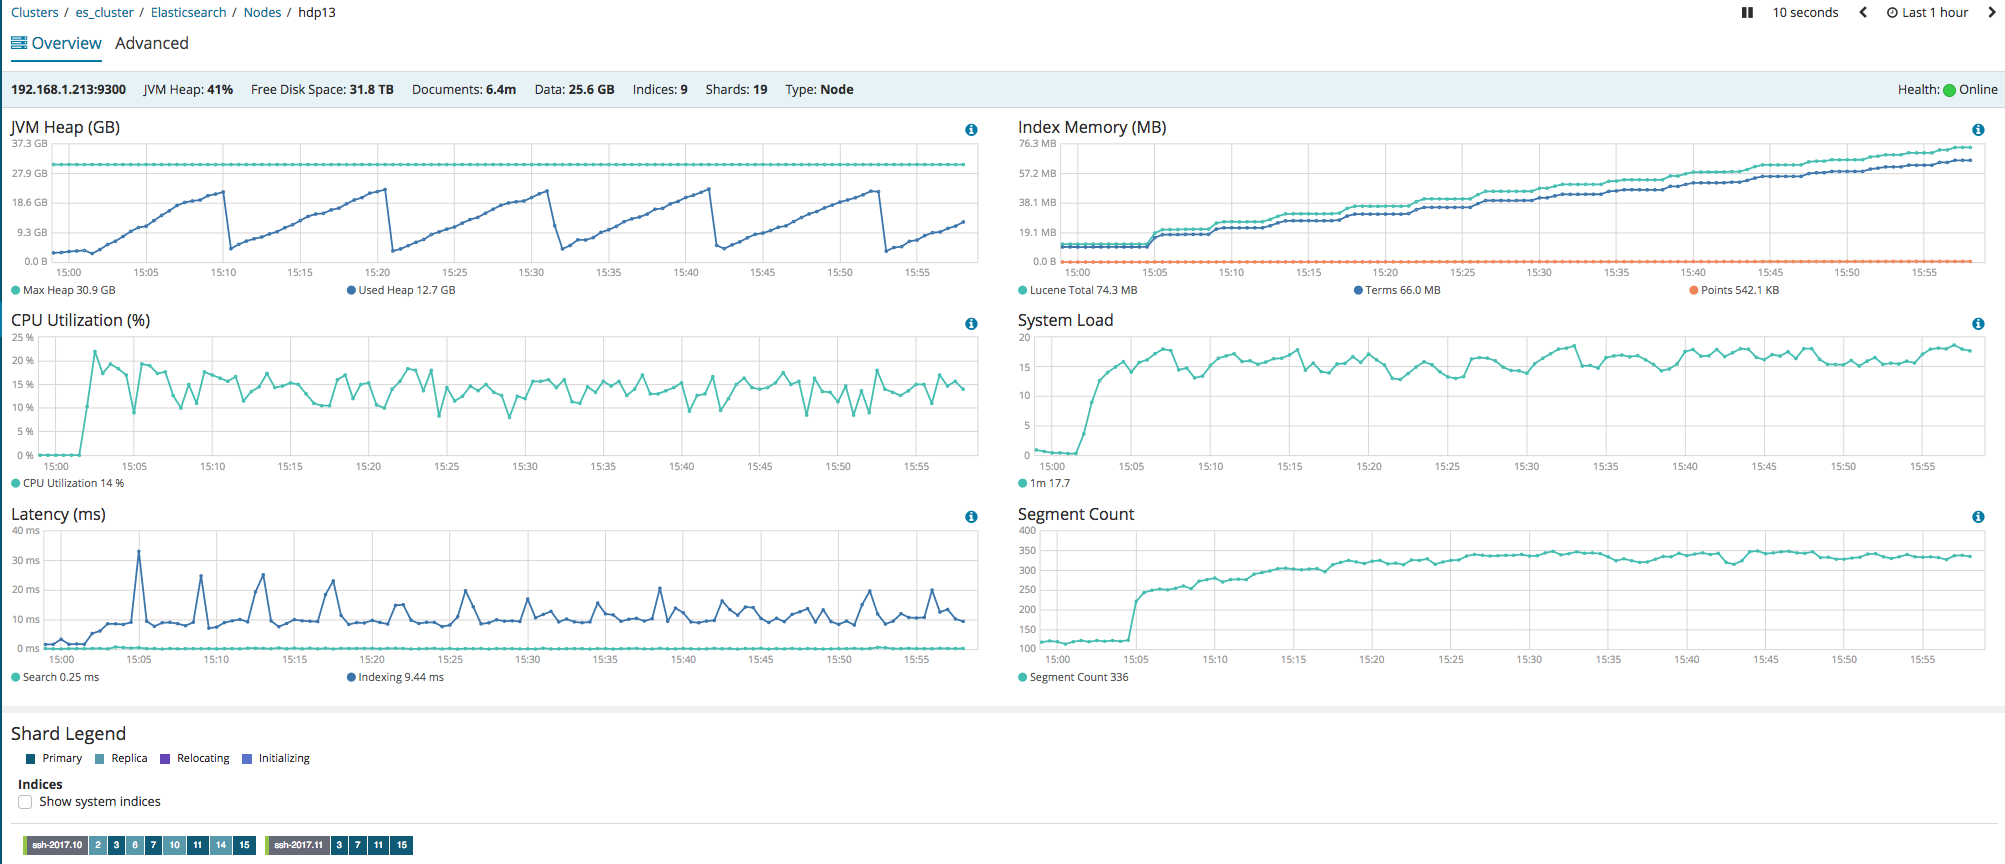
Attached are some screenshots of an ES node. Any ideas on how I might explore increasing the performance. I only care about bulk ingesting. I don't care about search performance at this stage.
---
### Author:  [@Egor1](https://discuss.elastic.co/u/Egor1)
#### Post date: [November 24, 2017, 5:11pm UTC](https://discuss.elastic.co/t/elasticsearch-basic-performance/109053/2 "2017-11-24T17:11:33Z")
On the last graph, it's clear that the number of index segments expolded once you started ingestion. As you on spinning media, segments merging can impact performance badly, so [have a look how to tune this.](https://www.elastic.co/guide/en/elasticsearch/guide/current/indexing-performance.html#segments-and-merging)
Also, given that you don't care about search during the indexing, consider changing index.refresh\_interval, so you have fewer segments created in the first place, [see doc](https://www.elastic.co/guide/en/elasticsearch/reference/master/tune-for-indexing-speed.html#_disable_refresh_and_replicas_for_initial_loads).
---
### Author:  [@elastic\_paul](https://discuss.elastic.co/u/elastic_paul)
#### Post date: [November 24, 2017, 5:58pm UTC](https://discuss.elastic.co/t/elasticsearch-basic-performance/109053/3 "2017-11-24T17:58:00Z")
Thanks for the reply.
Unfortunately that has all been removed in 6.0 ☹
```auto
Store throttling has been removed. As a consequence, the indices.store.throttle.type and indices.store.throttle.max_bytes_per_sec cluster settings and the index.store.throttle.type and index.store.throttle.max_bytes_per_sec index settings are not recognized anymore.
```
I already have refresh to -1 and replication to 0
---
### Author:  [@Egor1](https://discuss.elastic.co/u/Egor1)
#### Post date: [November 24, 2017, 6:30pm UTC](https://discuss.elastic.co/t/elasticsearch-basic-performance/109053/4 "2017-11-24T18:30:23Z")
How about [index.merge.scheduler.max\_thread\_count](https://www.elastic.co/guide/en/elasticsearch/reference/6.0/index-modules-merge.html). Also play around with batch size, although, you probably have tried this already.
---
### Author:  [@Christian\_Dahlqvist](https://discuss.elastic.co/u/Christian_Dahlqvist)
#### Post date: [November 25, 2017, 11:01am UTC](https://discuss.elastic.co/t/elasticsearch-basic-performance/109053/5 "2017-11-25T11:01:52Z")
How many disks do you have per node? Are these set up as multiple data paths or using some RAID configuration? With only 4 active shards per node, are you utilizing all disks when indexing?
What does disk I/O and iowait look like?
What is the average size of your documents? Are you using the default Logstash settings around batch and bulk size?
---
### Author:  [@elastic\_paul](https://discuss.elastic.co/u/elastic_paul)
#### Post date: [November 27, 2017, 10:28am UTC](https://discuss.elastic.co/t/elasticsearch-basic-performance/109053/6 "2017-11-27T10:28:08Z")
12 spinning disks per node. Multiple data paths, no RAID
With 4 shards per node I won't be accessing all disks. Should I make it 12 shards per node? That would be 48 shards per index?
```auto
Device: rrqm/s wrqm/s r/s w/s rsec/s wsec/s avgrq-sz avgqu-sz await r_await w_await svctm %util
sda 0.00 9.61 0.02 0.50 2.20 80.80 158.17 0.08 161.75 3.06 168.42 3.34 0.18
sdc 0.00 7.09 0.03 0.46 3.04 60.27 129.61 0.06 112.80 3.49 119.45 3.68 0.18
sdd 0.00 4.89 0.02 0.23 3.39 40.86 177.80 0.04 179.64 2.97 197.80 2.99 0.07
sdf 0.00 9.17 0.01 0.62 0.79 78.12 126.55 0.09 147.24 7.15 148.98 3.21 0.20
sde 0.00 8.52 0.03 0.58 5.15 72.58 127.08 0.07 111.04 3.40 116.22 3.55 0.22
sdg 0.00 14.40 0.01 1.45 0.89 126.19 87.45 0.15 103.39 7.33 103.92 3.54 0.51
sdb 0.00 13.44 0.05 1.70 4.28 120.60 71.33 0.09 53.94 4.67 55.34 3.15 0.55
sdh 0.00 18.96 0.07 2.39 9.04 170.26 73.01 0.15 62.62 3.13 64.32 2.64 0.65
sdi 0.00 8.01 0.01 0.33 1.59 66.60 200.46 0.08 221.19 5.04 227.82 3.82 0.13
sdk 0.00 19.82 0.05 1.90 4.89 173.13 91.48 0.15 74.63 4.88 76.46 3.90 0.76
sdl 0.00 1.61 0.01 0.11 0.98 13.72 128.81 0.02 149.83 10.26 160.44 4.28 0.05
sdj 0.00 17.04 0.03 1.61 3.02 148.69 92.33 0.13 76.20 4.20 77.74 3.60 0.59
```
---
### Author:  [@Christian\_Dahlqvist](https://discuss.elastic.co/u/Christian_Dahlqvist)
#### Post date: [November 27, 2017, 10:37am UTC](https://discuss.elastic.co/t/elasticsearch-basic-performance/109053/7 "2017-11-27T10:37:50Z")
You seem to have a fair bit of await across quite a few of the disks. Did you change the `index.merge.scheduler.max_thread_count` parameter to 1? Did it make any difference?
How many documents are you sending per bulk request? It might be worth to try increasing the [pipeline.batch.size](https://www.elastic.co/guide/en/logstash/current/tuning-logstash.html) to e.g. 1000, in order to get larger bulk requests sent to Elasticsearch.
---
### Author:  [@elastic\_paul](https://discuss.elastic.co/u/elastic_paul)
#### Post date: [November 27, 2017, 11:00am UTC](https://discuss.elastic.co/t/elasticsearch-basic-performance/109053/8 "2017-11-27T11:00:42Z")
> [@Christian\_Dahlqvist](#):
>
> index.merge.scheduler.max\_thread\_count
Yes, I have now made that change, and I have increased shards to 48, so 12 per node, so 1 per disk.
```auto
Device: rrqm/s wrqm/s r/s w/s rsec/s wsec/s avgrq-sz avgqu-sz await r_await w_await svctm %util
sda 0.00 277.40 0.00 169.00 0.00 3373.60 19.96 1.16 6.88 0.00 6.88 5.58 94.29
sdc 0.00 441.70 0.00 129.20 0.00 4452.00 34.46 1.33 10.26 0.00 10.26 7.61 98.38
sdd 0.00 429.20 0.00 152.50 0.00 4505.60 29.54 1.35 8.88 0.00 8.88 6.42 97.96
sdf 0.00 258.20 0.00 150.90 0.00 3099.20 20.54 1.19 7.90 0.00 7.90 6.30 95.06
sde 0.00 327.50 0.00 145.00 0.00 3625.60 25.00 1.27 8.77 0.00 8.77 6.76 98.01
sdg 0.00 310.70 0.00 147.30 0.00 3499.20 23.76 1.19 8.05 0.00 8.05 6.57 96.83
sdb 0.00 268.00 0.00 148.10 0.00 3150.40 21.27 1.11 7.49 0.00 7.49 6.38 94.43
sdh 0.00 656.30 0.00 146.50 0.00 6290.40 42.94 1.54 10.51 0.00 10.51 6.70 98.21
sdi 0.00 283.10 0.00 127.30 0.00 3141.60 24.68 1.30 10.17 0.00 10.17 7.72 98.28
sdk 0.00 288.50 0.00 125.30 0.00 3171.20 25.31 1.22 9.68 0.00 9.68 7.84 98.29
sdl 0.00 254.50 0.00 125.50 0.00 2891.20 23.04 1.18 9.39 0.00 9.39 7.81 98.03
sdj 0.00 377.80 0.00 145.00 0.00 4037.60 27.85 1.28 8.80 0.00 8.80 6.74 97.79
```
Haven't tried increasing pool but get lots of these warnings, with pool size of 600.
```auto
[2017-11-27T10:56:28,923][INFO][logstash.outputs.elasticsearch] retrying failed action with response code: 429 ({"type"=>"es_rejected_execution_exception", "reason"=>"rejected execution of org.elasticsearch.transport.TransportService$7@4e97be78 on EsThreadPoolExecutor[bulk, queue capacity = 600, org.elasticsearch.common.util.concurrent.EsThreadPoolExecutor@52739ce6[Running, pool size = 25, active threads = 25, queued tasks = 600, completed tasks = 38363803]]"})
```
---
### Author:  [@Christian\_Dahlqvist](https://discuss.elastic.co/u/Christian_Dahlqvist)
#### Post date: [November 27, 2017, 11:05am UTC](https://discuss.elastic.co/t/elasticsearch-basic-performance/109053/9 "2017-11-27T11:05:42Z")
Increasing the shard count might actually make your bulk rejection issues worse, as described in [this blog post](https://www.elastic.co/blog/why-am-i-seeing-bulk-rejections-in-my-elasticsearch-cluster). You have a lot of Logstash instances sending data to the cluster in parallel, so it may make a lot of sense to increase the pipeline batch size to get fewer, but larger, bulk requests.
How come you have so many Logstash instances for so few Elasticsearch nodes? Generally just a few Logstash instances can saturate a cluster that size unless they are doing very heavy or inefficient processing of events.
---
### Author:  [@elastic\_paul](https://discuss.elastic.co/u/elastic_paul)
#### Post date: [November 27, 2017, 11:29am UTC](https://discuss.elastic.co/t/elasticsearch-basic-performance/109053/10 "2017-11-27T11:29:09Z")
I am sending the data from a hadoop cluster which has 12 nodes. I use the reduce part of a MR job to send the data to the 4 ES nodes. If I set the number of reducers down to 4 then it would only ever have 4 nodes sending to the 4 ES nodes. I will experiment with this, starting with reducers=1!
---
### Author:  [@Abhilash\_Bolla](https://discuss.elastic.co/u/Abhilash_Bolla)
#### Post date: [November 28, 2017, 10:27am UTC](https://discuss.elastic.co/t/elasticsearch-basic-performance/109053/11 "2017-11-28T10:27:59Z")
Hey Paul, May I know which tool you use for monitoring performance parameters of a node?
---
### Author:  [@elastic\_paul](https://discuss.elastic.co/u/elastic_paul)
#### Post date: [November 28, 2017, 1:04pm UTC](https://discuss.elastic.co/t/elasticsearch-basic-performance/109053/12 "2017-11-28T13:04:44Z")
I am using (or trying to use) the X-Pack plugin and on the actual nodes is use iostat
---
### Author:  [@system](https://discuss.elastic.co/u/system)
#### Post date: [December 26, 2017, 1:04pm UTC](https://discuss.elastic.co/t/elasticsearch-basic-performance/109053/13 "2017-12-26T13:04:47Z")
This topic was automatically closed 28 days after the last reply. New replies are no longer allowed.