# Elasticsearch high cpu usage while searching
**URL:** https://discuss.elastic.co/t/elasticsearch-high-cpu-usage-while-searching/50832
**Category:** Elasticsearch
**Created:** [May 24, 2016, 11:48am UTC](https://discuss.elastic.co/t/elasticsearch-high-cpu-usage-while-searching/50832 "2016-05-24T11:48:32Z")
**Posts on this page:** 6
**Page:** 1
### Author:  [@vikas.saini](https://discuss.elastic.co/u/vikas.saini)
#### Post date: [May 24, 2016, 11:48am UTC](https://discuss.elastic.co/t/elasticsearch-high-cpu-usage-while-searching/50832/1 "2016-05-24T11:48:32Z")
This is my output of hot threads ! cpu usage is 100 % please suggest something
::: [Mad Dog Rassitano][2dJw-2L7QCaMF2aFWwvVHQ][bladem610][inet[/127.0.0.1:9300]]
Hot threads at 2016-05-24T09:42:51.992Z, interval=500ms, busiestThreads=3, ignoreIdleThreads=true:
37.4% (187.2ms out of 500ms) cpu usage by thread 'elasticsearch[Mad Dog Rassitano][search][T#9]'
5/10 snapshots sharing following 14 elements
org.elasticsearch.search.internal.ContextIndexSearcher.search(ContextIndexSearcher.java:191)
org.apache.lucene.search.IndexSearcher.search(IndexSearcher.java:491)
org.apache.lucene.search.IndexSearcher.search(IndexSearcher.java:448)
org.apache.lucene.search.IndexSearcher.search(IndexSearcher.java:281)
org.apache.lucene.search.IndexSearcher.search(IndexSearcher.java:269)
org.elasticsearch.search.query.QueryPhase.execute(QueryPhase.java:157)
org.elasticsearch.search.SearchService.loadOrExecuteQueryPhase(SearchService.java:301)
org.elasticsearch.search.SearchService.executeQueryPhase(SearchService.java:312)
org.elasticsearch.search.action.SearchServiceTransportAction$5.call(SearchServiceTransportAction.java:231)
org.elasticsearch.search.action.SearchServiceTransportAction$5.call(SearchServiceTransportAction.java:228)
org.elasticsearch.search.action.SearchServiceTransportAction$23.run(SearchServiceTransportAction.java:559)
java.util.concurrent.ThreadPoolExecutor.runWorker(ThreadPoolExecutor.java:1145)
java.util.concurrent.ThreadPoolExecutor$Worker.run(ThreadPoolExecutor.java:615)
java.lang.Thread.run(Thread.java:745)
5/10 snapshots sharing following 2 elements
java.util.concurrent.ThreadPoolExecutor$Worker.run(ThreadPoolExecutor.java:615)
java.lang.Thread.run(Thread.java:745)
28.1% (140.4ms out of 500ms) cpu usage by thread 'elasticsearch[Mad Dog Rassitano][search][T#6]'
2/10 snapshots sharing following 20 elements
org.elasticsearch.search.aggregations.AggregationPhase$AggregationsCollector.collect(AggregationPhase.java:161)
org.elasticsearch.common.lucene.MultiCollector.collect(MultiCollector.java:60)
org.apache.lucene.search.Weight$DefaultBulkScorer.scoreAll(Weight.java:193)
org.apache.lucene.search.Weight$DefaultBulkScorer.score(Weight.java:163)
org.apache.lucene.search.BulkScorer.score(BulkScorer.java:35)
org.apache.lucene.search.IndexSearcher.search(IndexSearcher.java:621)
org.elasticsearch.search.internal.ContextIndexSearcher.search(ContextIndexSearcher.java:191)
org.apache.lucene.search.IndexSearcher.search(IndexSearcher.java:491)
org.apache.lucene.search.IndexSearcher.search(IndexSearcher.java:448)
org.apache.lucene.search.IndexSearcher.search(IndexSearcher.java:281)
org.apache.lucene.search.IndexSearcher.search(IndexSearcher.java:269)
org.elasticsearch.search.query.QueryPhase.execute(QueryPhase.java:157)
---
### Author:  [@warkolm](https://discuss.elastic.co/u/warkolm)
#### Post date: [May 24, 2016, 8:53pm UTC](https://discuss.elastic.co/t/elasticsearch-high-cpu-usage-while-searching/50832/2 "2016-05-24T20:53:31Z")
That doesn't look too bad, are you having problems with the load, or you just don't want it to be 100%?
---
### Author:  [@vikas.saini](https://discuss.elastic.co/u/vikas.saini)
#### Post date: [May 25, 2016, 7:06am UTC](https://discuss.elastic.co/t/elasticsearch-high-cpu-usage-while-searching/50832/3 "2016-05-25T07:06:37Z")
I am testing search with JMETER .100 users get logged in to my app and fire search queries .
But when the total number of queries fired get above 2000 ,CPU usage start increasing diagonally and reaches up to 90-100 % .
I use **query string query** only .Using query string query I fire wild card ,multiple word ,AND ,OR query etc .
So ultimately I fire a **filtered** query .
I use terms aggregation and two or three **Range aggregation** in my Queries .
Is it the case that my queries are too heavy or anything else is wrong .
Environment I am using
RAM 8 GB
2 intel i3 processors both 2.3 GHz
---
### Author:  [@warkolm](https://discuss.elastic.co/u/warkolm)
#### Post date: [May 25, 2016, 7:20am UTC](https://discuss.elastic.co/t/elasticsearch-high-cpu-usage-while-searching/50832/4 "2016-05-25T07:20:03Z")
I wouldn't use CPU use as a good measure.
Are your queries returning in a decent time? Are you getting threadpool rejections?
---
### Author:  [@vikas.saini](https://discuss.elastic.co/u/vikas.saini)
#### Post date: [May 25, 2016, 8:53am UTC](https://discuss.elastic.co/t/elasticsearch-high-cpu-usage-while-searching/50832/5 "2016-05-25T08:53:26Z")
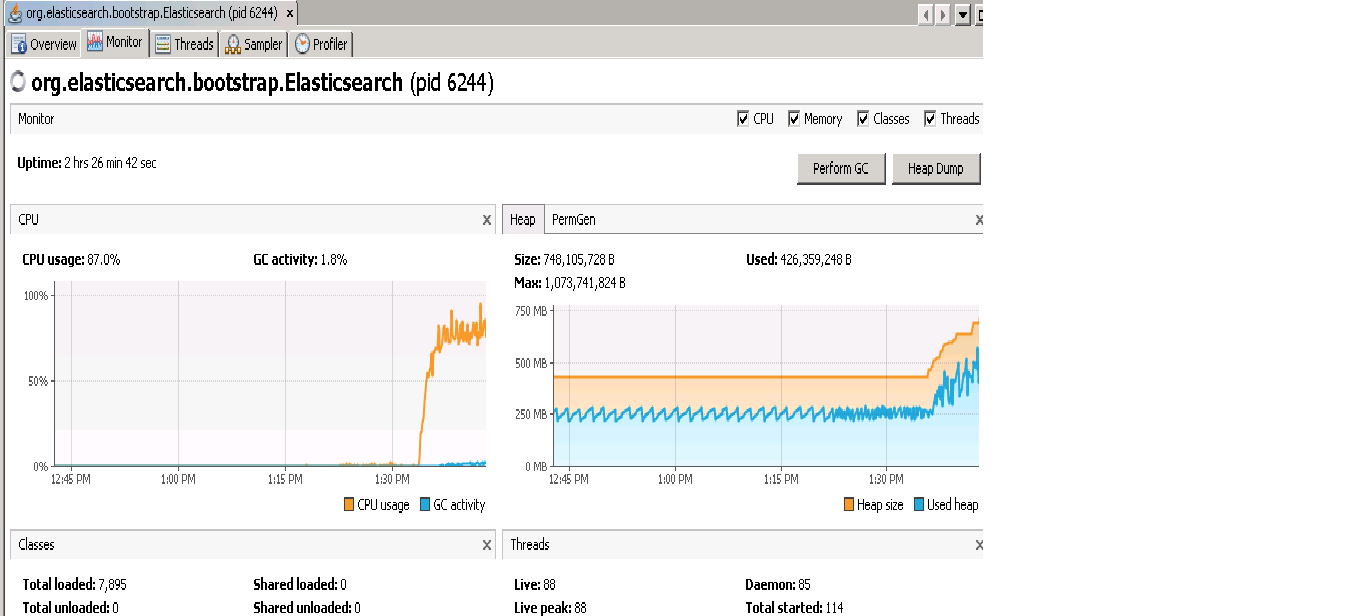
This is my cpu and heap usage while searching with Jmeter .
My only concern is why it is increaing drastically .
Jmeter report is
Label,# Samples, Average, Min, Max,Std. Dev.,Error %,Throughput,KB/sec,Avg. Bytes
Launch Login Page,150,36,21,176,24.10,0.00%,.2,16.22,93063.6
Login in OD,150,12129,90,391152,62759.40,0.00%,.1,71.26,596230.6
Search Single Word from OD Interface,143,10703,6,311023,40598.54,3.50%,.1,25.20,240168.7
Search Multiple Words from ES Interface,143,18105,6,315128,63899.35,2.80%,.1,1.97,19604.3
Search on File Name from ES Interface,129,39449,6,580411,123187.17,9.30%,.1,0.21,2330.1
Search Specific word using Double Quotes,126,18101,6,324817,55222.77,2.38%,.1,0.55,6203.7
Back to OD Interface,439,11229,36,387473,51601.36,0.00%,.3,22.88,71742.9
Multiple Word Search from OD Interface,114,11903,6,317704,46715.65,4.39%,.1,1.08,12868.7
File Name Search from OD Interface,104,2862,6,98077,14673.69,2.88%,.1,0.63,7550.3
Search Specific word from OD Interface,100,109,6,157,22.10,3.00%,.2,1.97,9924.1
Search Single word from ES Interface,100,89,6,212,27.91,3.00%,.2,0.90,4548.9
Logout From ES Interface,100,61,48,202,21.77,0.00%,.2,10.46,52756.8
TOTAL,1798,11081,6,580411,54656.72,2.11%,1.2,120.84,101276.0
---
### Author:  [@system](https://discuss.elastic.co/u/system)
#### Post date: [July 5, 2017, 10:49pm UTC](https://discuss.elastic.co/t/elasticsearch-high-cpu-usage-while-searching/50832/6 "2017-07-05T22:49:08Z")