# Error in Dashboard/ \[filebeat System\]
**URL:** https://discuss.elastic.co/t/error-in-dashboard-filebeat-system/257731
**Category:** Kibana
**Created:** [December 5, 2020, 1:13pm UTC](https://discuss.elastic.co/t/error-in-dashboard-filebeat-system/257731 "2020-12-05T13:13:47Z")
**Posts on this page:** 12
**Page:** 1
### Author:  [@prat](https://discuss.elastic.co/u/prat)
#### Post date: [December 5, 2020, 1:13pm UTC](https://discuss.elastic.co/t/error-in-dashboard-filebeat-system/257731/1 "2020-12-05T13:13:47Z")
Hi Team,
1.
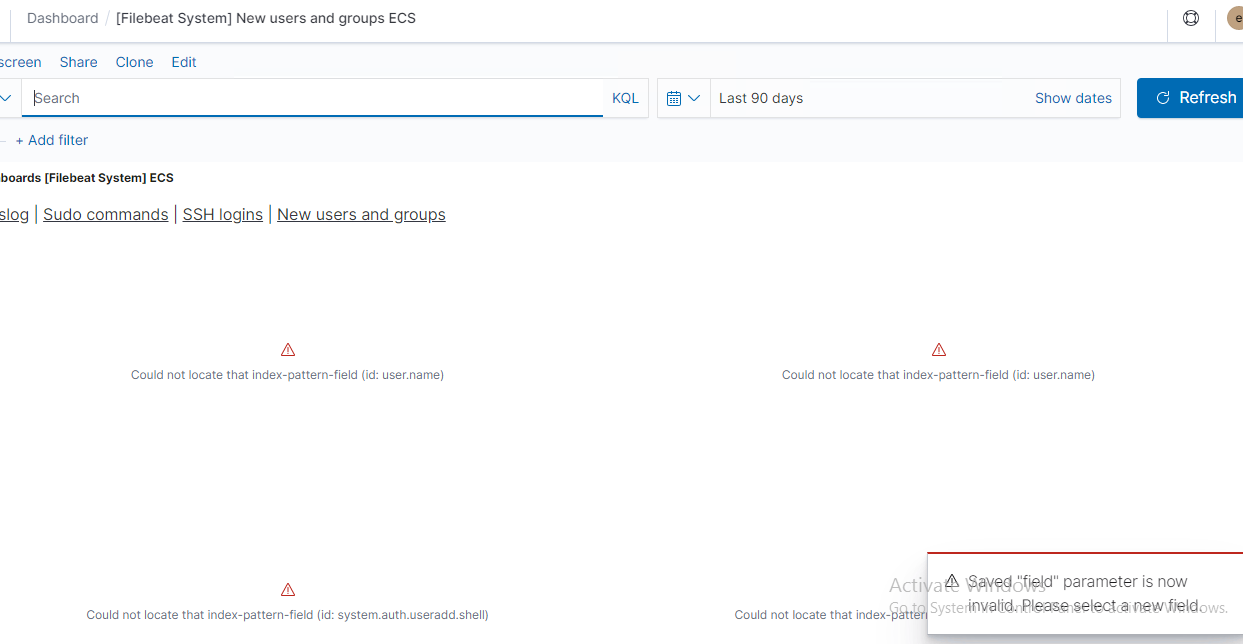
I am getting error (as attached) when clicked in Dashboard and selected file-beat, here I am getting error for tabs `Sudo commands | SSH logins | New users and groups`. How can I see all this information.


1.
I have enabled filebeat system module so I can see logs coming to syslog tab but at right side bottom error windows pops up as `save "field" parameter is now invalid. Please select a new field.` and `Error in visualization. [esaggs] > is a required parameter`.

elasticsearch version - 7.4.0
kibana - 7.4.0
filebeat - 7.4.0
Can you please help to solve this.
Thanks,
---
### Author:  [@aaron-nimocks](https://discuss.elastic.co/u/aaron-nimocks)
#### Post date: [December 5, 2020, 2:26pm UTC](https://discuss.elastic.co/t/error-in-dashboard-filebeat-system/257731/2 "2020-12-05T14:26:09Z")
Try to refresh your index pattern.

If that doesn't work might want to delete those dashboards and visualizations and [re-import the dashboards](https://www.elastic.co/guide/en/beats/filebeat/current/load-kibana-dashboards.html).
---
### Author:  [@prat](https://discuss.elastic.co/u/prat)
#### Post date: [December 7, 2020, 1:41pm UTC](https://discuss.elastic.co/t/error-in-dashboard-filebeat-system/257731/3 "2020-12-07T13:41:05Z")
Hi @aaron-nimocks,
Thanks for your reply.
I refreshred `field list` for `filebeat-*` in `Index Patterns` and tried to see Dashboard for [Filebeat System] but its still showing those errors.
deleting dashboards looks ok - I need to go into `Dashboards` and delete `SSH login attempts ECS`, `New users and groups ECS`, `Sudo commands ECS`
and same thing need to repeat in `Visualizations` tab.
for [re-importing](https://www.elastic.co/guide/en/beats/filebeat/current/load-kibana-dashboards.html), the documents says `If you’ve configured the Logstash output, see Load dashboards for Logstash output` but in my case `kafka output is enabled` (I am saying this because `output.kafka` is mentioned in `filebeat.yml`)
so how can I re-import filebeat `dashboards` and `visualisations` when filebeat is sending data to `kafka`.
Thanks,
---
### Author:  [@aaron-nimocks](https://discuss.elastic.co/u/aaron-nimocks)
#### Post date: [December 7, 2020, 1:53pm UTC](https://discuss.elastic.co/t/error-in-dashboard-filebeat-system/257731/4 "2020-12-07T13:53:33Z")
By running `./filebeat setup --dashboards` in the command line it can do it manually. You need to have your Kibana settings in the yml file for this to work.
---
### Author:  [@prat](https://discuss.elastic.co/u/prat)
#### Post date: [December 7, 2020, 4:00pm UTC](https://discuss.elastic.co/t/error-in-dashboard-filebeat-system/257731/5 "2020-12-07T16:00:36Z")
Hi @aaron-nimocks,
I deleted each (sudo commands, SSH logins, New users and groups) from `Dashboard` and `Visualize` tab and ran
`filebeat setup --dashboards`
it gave output as,
`Loading dashboards (kibana must be running and reachable)`
`Loaded dashboards`
it is still showing same errors in Dashboards for [filebeat system] for Sudo commands, SSH logins etc..
I also restarted `filebeat service` but no luck.
---
### Author:  [@prat](https://discuss.elastic.co/u/prat)
#### Post date: [December 7, 2020, 4:24pm UTC](https://discuss.elastic.co/t/error-in-dashboard-filebeat-system/257731/6 "2020-12-07T16:24:38Z")
I have below in `filebeat.yml`
```auto
setup.kibana:
host: "localhost:8601"
username: elastic
password: Password
```
its a single cluster so kibana also running on same node and kibana service is running.
---
### Author:  [@aaron-nimocks](https://discuss.elastic.co/u/aaron-nimocks)
#### Post date: [December 7, 2020, 4:29pm UTC](https://discuss.elastic.co/t/error-in-dashboard-filebeat-system/257731/7 "2020-12-07T16:29:08Z")
In your index and pattern do you see `system.auth.ssh.event`?
Does your [system module config](https://www.elastic.co/guide/en/beats/filebeat/current/filebeat-module-system.html) have it enabled?
---
### Author:  [@prat](https://discuss.elastic.co/u/prat)
#### Post date: [December 7, 2020, 4:44pm UTC](https://discuss.elastic.co/t/error-in-dashboard-filebeat-system/257731/8 "2020-12-07T16:44:54Z")
do you mean to say `Index Patterns`?
I can't see `system.auth.ssh.event` in `Index Patterns` ---\> `filebeat-*`
Inside it i have searched `system.auth.ssh.event` in Filter search bar.
(actually in `index pattern`, I can see two filebeat-\* (one has 33 Fields and other has 570 Fields) may be due to some issue). I have checked in both of them.
`system` module is enabled and I can see it in `Enabled` after running `filebeat modules list` command. The `/etc/filebeat/modules.d/system.yml` is default, i.e haven't changes anything in it.
---
### Author:  [@aaron-nimocks](https://discuss.elastic.co/u/aaron-nimocks)
#### Post date: [December 7, 2020, 4:59pm UTC](https://discuss.elastic.co/t/error-in-dashboard-filebeat-system/257731/9 "2020-12-07T16:59:12Z")
If you don't have any `system.auth.xxx.xxx` fields then I don't think you are getting that data.
```auto
- module: system
syslog:
enabled: true
var.paths: ["/path/to/log/syslog*"]
auth:
enabled: true
var.paths: ["/path/to/log/auth.log*"]
```
I'd start by verifying the path to the logs for auth and seeing if it's correct and does the log have the correct data.
---
### Author:  [@prat](https://discuss.elastic.co/u/prat)
#### Post date: [December 7, 2020, 5:30pm UTC](https://discuss.elastic.co/t/error-in-dashboard-filebeat-system/257731/10 "2020-12-07T17:30:59Z")
this is `/etc/filebeat/modules.d/system.yml`
```auto
# Module: system
# Docs: https://www.elastic.co/guide/en/beats/filebeat/7.4/filebeat-module-system.html
- module: system
# Syslog
syslog:
enabled: true
# Set custom paths for the log files. If left empty,
# Filebeat will choose the paths depending on your OS.
#var.paths:
# Authorization logs
auth:
enabled: true
# Set custom paths for the log files. If left empty,
# Filebeat will choose the paths depending on your OS.
#var.paths:
```
assuming it's looking for data into `/var/log/syslog` for default path.
I can't search any word for ssh,sudo or user in syslog file.
Do you mean to say because I am not getting any ssh related messages or sudo related logs in syslog file, its not showing data for those dashboard ?
---
### Author:  [@aaron-nimocks](https://discuss.elastic.co/u/aaron-nimocks)
#### Post date: [December 7, 2020, 6:14pm UTC](https://discuss.elastic.co/t/error-in-dashboard-filebeat-system/257731/11 "2020-12-07T18:14:35Z")
Correct. Syslog won't get that data. Auth logs will.
Need to find those logs for your system and make sure that data is being generated. Usually [auditd module](https://www.elastic.co/guide/en/beats/filebeat/current/filebeat-module-auditd.html) will do this with filebeats.
---
### Author:  [@system](https://discuss.elastic.co/u/system)
#### Post date: [January 4, 2021, 6:14pm UTC](https://discuss.elastic.co/t/error-in-dashboard-filebeat-system/257731/12 "2021-01-04T18:14:39Z")
This topic was automatically closed 28 days after the last reply. New replies are no longer allowed.