# ES 6.1.1 Server with small data goes into GC loop
**URL:** https://discuss.elastic.co/t/es-6-1-1-server-with-small-data-goes-into-gc-loop/130340
**Category:** Elasticsearch
**Created:** [May 3, 2018, 12:22am UTC](https://discuss.elastic.co/t/es-6-1-1-server-with-small-data-goes-into-gc-loop/130340 "2018-05-03T00:22:26Z")
**Posts on this page:** 16
**Page:** 1
### Author:  [@reedzhao](https://discuss.elastic.co/u/reedzhao)
#### Post date: [May 3, 2018, 12:22am UTC](https://discuss.elastic.co/t/es-6-1-1-server-with-small-data-goes-into-gc-loop/130340/1 "2018-05-03T00:22:26Z")
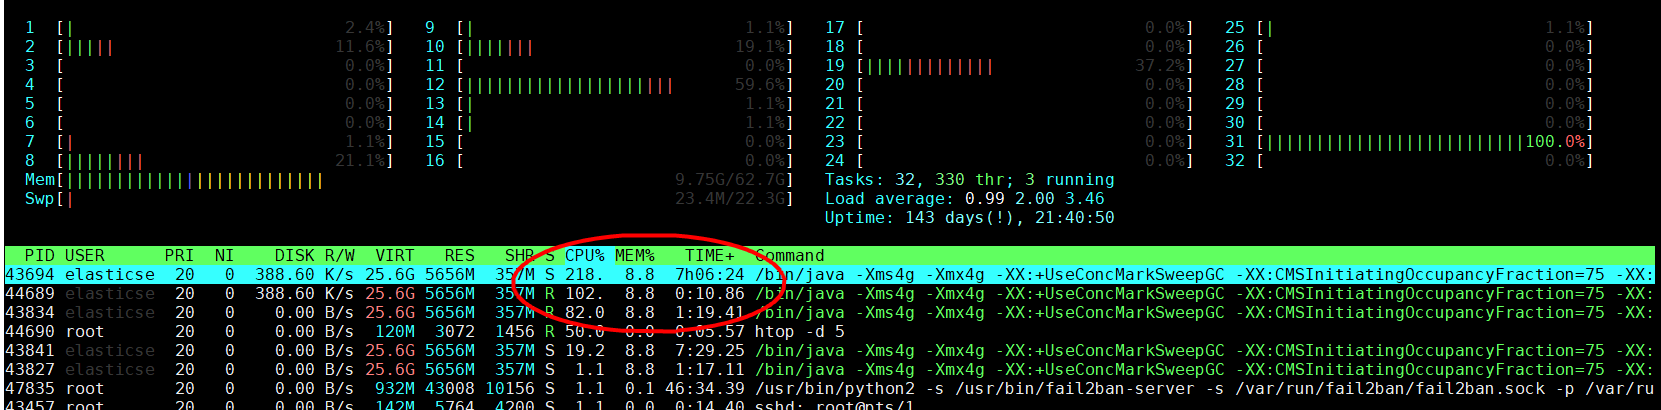
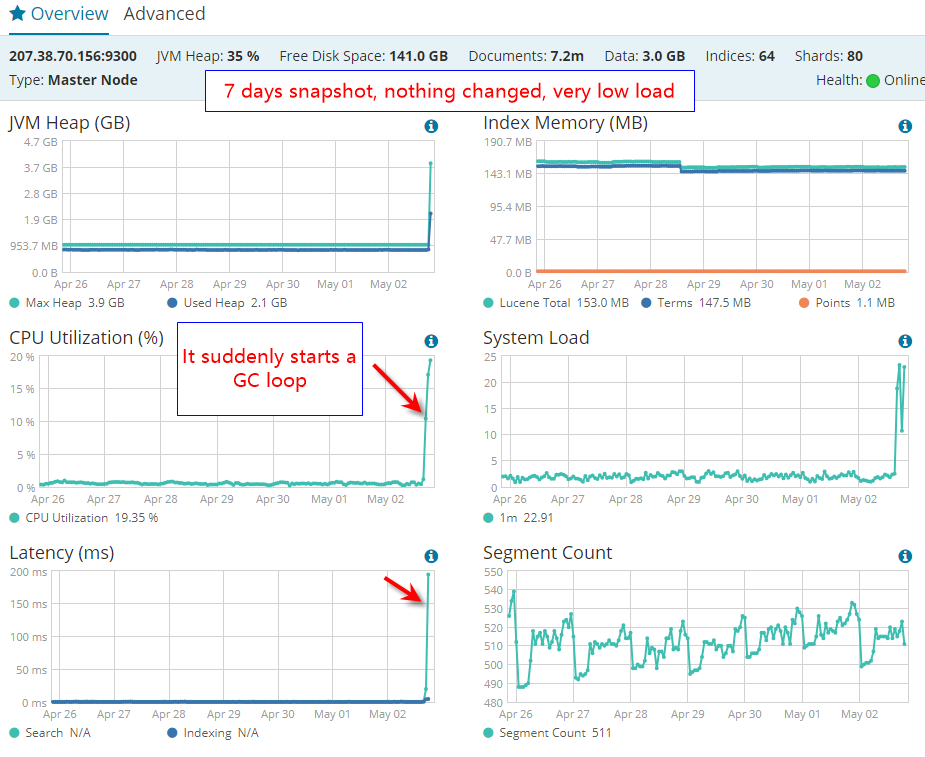
I have a small ES deployment that has been running fine for about 4 months. Today it suddenly start to use up all CPU. No change in query code, no change in traffic load. It just suddenly start to do a lot of GC.
My deployment is really small:
1 node(no cluster), 1 index, 695.4k document, ~ 370mb
index rate ~ 2/s
search rate ~ 5/s
Server:
64GB ram / 50GB free
32 logical cores
It has 1GB heap initially, after seeing GC loop, I changed to 4GB heap and restarted elasticsearch. The problem still there, constant GC loop.
**How can I stop this GC loop?**
```auto
java -version
openjdk version "1.8.0_151"
OpenJDK Runtime Environment (build 1.8.0_151-b12)
OpenJDK 64-Bit Server VM (build 25.151-b12, mixed mode)
```
```auto
[2018-05-02T19:47:38,279][INFO][o.e.m.j.JvmGcMonitorService] [EEvTfAV] [gc][2826] overhead, spent [340ms] collecting in the last [1s]
[2018-05-02T19:48:49,070][INFO][o.e.m.j.JvmGcMonitorService] [EEvTfAV] [gc][2896] overhead, spent [357ms] collecting in the last [1.3s]
[2018-05-02T19:49:49,380][INFO][o.e.m.j.JvmGcMonitorService] [EEvTfAV] [gc][2956] overhead, spent [274ms] collecting in the last [1s]
[2018-05-02T19:51:04,878][INFO][o.e.m.j.JvmGcMonitorService] [EEvTfAV] [gc][3031] overhead, spent [353ms] collecting in the last [1.3s]
[2018-05-02T19:52:12,135][INFO][o.e.m.j.JvmGcMonitorService] [EEvTfAV] [gc][3098] overhead, spent [339ms] collecting in the last [1s]
[2018-05-02T19:53:24,666][INFO][o.e.m.j.JvmGcMonitorService] [EEvTfAV] [gc][3170] overhead, spent [319ms] collecting in the last [1s]
[2018-05-02T19:54:41,886][INFO][o.e.m.j.JvmGcMonitorService] [EEvTfAV] [gc][3247] overhead, spent [420ms] collecting in the last [1s]
```


.
---
### Author:  [@DavidTurner](https://discuss.elastic.co/u/DavidTurner)
#### Post date: [May 3, 2018, 8:20am UTC](https://discuss.elastic.co/t/es-6-1-1-server-with-small-data-goes-into-gc-loop/130340/2 "2018-05-03T08:20:49Z")
It looks like it's busy doing _something_. Could you share the outputs of `GET /_nodes/hot_threads` and `GET /_tasks` here?
---
### Author:  [@reedzhao](https://discuss.elastic.co/u/reedzhao)
#### Post date: [May 3, 2018, 9:16am UTC](https://discuss.elastic.co/t/es-6-1-1-server-with-small-data-goes-into-gc-loop/130340/3 "2018-05-03T09:16:01Z")
> [@DavidTurner](#):
>
> GET /\_nodes/hot\_threads
Thanks for helping. Here is the output
GET /\_nodes/hot\_threads
```auto
::: {EEvTfAV}{EEvTfAV0QN-RBB8dGd23EA}{3zYtAjv9TIyFYT0hDdsazA}{207.38.70.156}{207.38.70.156:9300}{ml.machine_memory=67335802880, ml.max_open_jobs=20, ml.enabled=true}
Hot threads at 2018-05-03T09:12:01.786Z, interval=500ms, busiestThreads=3, ignoreIdleThreads=true:
29.2% (146.1ms out of 500ms) cpu usage by thread 'elasticsearch[EEvTfAV][refresh][T#2]'
2/10 snapshots sharing following 31 elements
org.apache.lucene.index.PointValuesWriter.flush(PointValuesWriter.java:183)
org.apache.lucene.index.DefaultIndexingChain.writePoints(DefaultIndexingChain.java:202)
org.apache.lucene.index.DefaultIndexingChain.flush(DefaultIndexingChain.java:137)
org.apache.lucene.index.DocumentsWriterPerThread.flush(DocumentsWriterPerThread.java:451)
org.apache.lucene.index.DocumentsWriter.doFlush(DocumentsWriter.java:542)
org.apache.lucene.index.DocumentsWriter.flushAllThreads(DocumentsWriter.java:658)
org.apache.lucene.index.IndexWriter.getReader(IndexWriter.java:453)
org.apache.lucene.index.StandardDirectoryReader.doOpenFromWriter(StandardDirectoryReader.java:293)
org.apache.lucene.index.StandardDirectoryReader.doOpenIfChanged(StandardDirectoryReader.java:268)
org.apache.lucene.index.StandardDirectoryReader.doOpenIfChanged(StandardDirectoryReader.java:258)
org.apache.lucene.index.FilterDirectoryReader.doOpenIfChanged(FilterDirectoryReader.java:104)
org.apache.lucene.index.DirectoryReader.openIfChanged(DirectoryReader.java:140)
org.apache.lucene.search.SearcherManager.refreshIfNeeded(SearcherManager.java:156)
org.apache.lucene.search.SearcherManager.refreshIfNeeded(SearcherManager.java:58)
org.apache.lucene.search.ReferenceManager.doMaybeRefresh(ReferenceManager.java:176)
org.apache.lucene.search.ReferenceManager.maybeRefreshBlocking(ReferenceManager.java:253)
org.elasticsearch.index.engine.InternalEngine$ExternalSearcherManager.refreshIfNeeded(InternalEngine.java:292)
org.elasticsearch.index.engine.InternalEngine$ExternalSearcherManager.refreshIfNeeded(InternalEngine.java:267)
org.apache.lucene.search.ReferenceManager.doMaybeRefresh(ReferenceManager.java:176)
org.apache.lucene.search.ReferenceManager.maybeRefreshBlocking(ReferenceManager.java:253)
org.elasticsearch.index.engine.InternalEngine.refresh(InternalEngine.java:1332)
org.elasticsearch.index.engine.InternalEngine.refresh(InternalEngine.java:1314)
org.elasticsearch.index.shard.IndexShard.refresh(IndexShard.java:855)
org.elasticsearch.index.IndexService.maybeRefreshEngine(IndexService.java:695)
org.elasticsearch.index.IndexService.access$400(IndexService.java:97)
org.elasticsearch.index.IndexService$AsyncRefreshTask.runInternal(IndexService.java:899)
org.elasticsearch.index.IndexService$BaseAsyncTask.run(IndexService.java:809)
org.elasticsearch.common.util.concurrent.ThreadContext$ContextPreservingRunnable.run(ThreadContext.java:568)
java.util.concurrent.ThreadPoolExecutor.runWorker(ThreadPoolExecutor.java:1149)
java.util.concurrent.ThreadPoolExecutor$Worker.run(ThreadPoolExecutor.java:624)
java.lang.Thread.run(Thread.java:748)
8/10 snapshots sharing following 28 elements
org.apache.lucene.index.DocumentsWriterPerThread.flush(DocumentsWriterPerThread.java:451)
org.apache.lucene.index.DocumentsWriter.doFlush(DocumentsWriter.java:542)
org.apache.lucene.index.DocumentsWriter.flushAllThreads(DocumentsWriter.java:658)
org.apache.lucene.index.IndexWriter.getReader(IndexWriter.java:453)
org.apache.lucene.index.StandardDirectoryReader.doOpenFromWriter(StandardDirectoryReader.java:293)
org.apache.lucene.index.StandardDirectoryReader.doOpenIfChanged(StandardDirectoryReader.java:268)
org.apache.lucene.index.StandardDirectoryReader.doOpenIfChanged(StandardDirectoryReader.java:258)
org.apache.lucene.index.FilterDirectoryReader.doOpenIfChanged(FilterDirectoryReader.java:104)
org.apache.lucene.index.DirectoryReader.openIfChanged(DirectoryReader.java:140)
org.apache.lucene.search.SearcherManager.refreshIfNeeded(SearcherManager.java:156)
org.apache.lucene.search.SearcherManager.refreshIfNeeded(SearcherManager.java:58)
org.apache.lucene.search.ReferenceManager.doMaybeRefresh(ReferenceManager.java:176)
org.apache.lucene.search.ReferenceManager.maybeRefreshBlocking(ReferenceManager.java:253)
org.elasticsearch.index.engine.InternalEngine$ExternalSearcherManager.refreshIfNeeded(InternalEngine.java:292)
org.elasticsearch.index.engine.InternalEngine$ExternalSearcherManager.refreshIfNeeded(InternalEngine.java:267)
org.apache.lucene.search.ReferenceManager.doMaybeRefresh(ReferenceManager.java:176)
org.apache.lucene.search.ReferenceManager.maybeRefreshBlocking(ReferenceManager.java:253)
org.elasticsearch.index.engine.InternalEngine.refresh(InternalEngine.java:1332)
org.elasticsearch.index.engine.InternalEngine.refresh(InternalEngine.java:1314)
org.elasticsearch.index.shard.IndexShard.refresh(IndexShard.java:855)
org.elasticsearch.index.IndexService.maybeRefreshEngine(IndexService.java:695)
org.elasticsearch.index.IndexService.access$400(IndexService.java:97)
org.elasticsearch.index.IndexService$AsyncRefreshTask.runInternal(IndexService.java:899)
org.elasticsearch.index.IndexService$BaseAsyncTask.run(IndexService.java:809)
org.elasticsearch.common.util.concurrent.ThreadContext$ContextPreservingRunnable.run(ThreadContext.java:568)
java.util.concurrent.ThreadPoolExecutor.runWorker(ThreadPoolExecutor.java:1149)
java.util.concurrent.ThreadPoolExecutor$Worker.run(ThreadPoolExecutor.java:624)
java.lang.Thread.run(Thread.java:748)
```
---
### Author:  [@reedzhao](https://discuss.elastic.co/u/reedzhao)
#### Post date: [May 3, 2018, 9:16am UTC](https://discuss.elastic.co/t/es-6-1-1-server-with-small-data-goes-into-gc-loop/130340/4 "2018-05-03T09:16:55Z")
GET /\_tasks
```auto
{
"nodes": {
"EEvTfAV0QN-RBB8dGd23EA": {
"name": "EEvTfAV",
"transport_address": "207.38.70.156:9300",
"host": "207.38.70.156",
"ip": "207.38.70.156:9300",
"roles": [
"master",
"data",
"ingest"
],
"attributes": {
"ml.machine_memory": "67335802880",
"ml.max_open_jobs": "20",
"ml.enabled": "true"
},
"tasks": {
"EEvTfAV0QN-RBB8dGd23EA:5752": {
"node": "EEvTfAV0QN-RBB8dGd23EA",
"id": 5752,
"type": "transport",
"action": "cluster:monitor/tasks/lists",
"start_time_in_millis": 1525338798562,
"running_time_in_nanos": 52693083,
"cancellable": false
},
"EEvTfAV0QN-RBB8dGd23EA:5753": {
"node": "EEvTfAV0QN-RBB8dGd23EA",
"id": 5753,
"type": "direct",
"action": "cluster:monitor/tasks/lists[n]",
"start_time_in_millis": 1525338798569,
"running_time_in_nanos": 46390587,
"cancellable": false,
"parent_task_id": "EEvTfAV0QN-RBB8dGd23EA:5752"
},
"EEvTfAV0QN-RBB8dGd23EA:5747": {
"node": "EEvTfAV0QN-RBB8dGd23EA",
"id": 5747,
"type": "direct",
"action": "indices:monitor/stats[n]",
"start_time_in_millis": 1525338796684,
"running_time_in_nanos": 1931824081,
"cancellable": false,
"parent_task_id": "EEvTfAV0QN-RBB8dGd23EA:5743"
},
"EEvTfAV0QN-RBB8dGd23EA:5743": {
"node": "EEvTfAV0QN-RBB8dGd23EA",
"id": 5743,
"type": "transport",
"action": "indices:monitor/stats",
"start_time_in_millis": 1525338796654,
"running_time_in_nanos": 1962028760,
"cancellable": false
}
}
}
}
}
```
---
### Author:  [@reedzhao](https://discuss.elastic.co/u/reedzhao)
#### Post date: [May 3, 2018, 9:22am UTC](https://discuss.elastic.co/t/es-6-1-1-server-with-small-data-goes-into-gc-loop/130340/5 "2018-05-03T09:22:21Z")
```auto
::: {EEvTfAV}{EEvTfAV0QN-RBB8dGd23EA}{3zYtAjv9TIyFYT0hDdsazA}{207.38.70.156}{207.38.70.156:9300}{ml.machine_memory=67335802880, ml.max_open_jobs=20, ml.enabled=true}
Hot threads at 2018-05-03T09:19:27.913Z, interval=500ms, busiestThreads=3, ignoreIdleThreads=true:
126.8% (633.7ms out of 500ms) cpu usage by thread 'elasticsearch[EEvTfAV][management][T#1]'
2/10 snapshots sharing following 37 elements
java.io.UnixFileSystem.canonicalize0(Native Method)
java.io.UnixFileSystem.canonicalize(UnixFileSystem.java:172)
java.io.File.getCanonicalPath(File.java:618)
java.io.FilePermission$1.run(FilePermission.java:215)
java.io.FilePermission$1.run(FilePermission.java:203)
java.security.AccessController.doPrivileged(Native Method)
java.io.FilePermission.init(FilePermission.java:203)
java.io.FilePermission.(FilePermission.java:277)
java.lang.SecurityManager.checkRead(SecurityManager.java:888)
sun.nio.fs.UnixPath.checkRead(UnixPath.java:795)
sun.nio.fs.UnixFileAttributeViews$Basic.readAttributes(UnixFileAttributeViews.java:49)
sun.nio.fs.UnixFileSystemProvider.readAttributes(UnixFileSystemProvider.java:144)
sun.nio.fs.LinuxFileSystemProvider.readAttributes(LinuxFileSystemProvider.java:99)
java.nio.file.Files.readAttributes(Files.java:1737)
java.nio.file.Files.size(Files.java:2332)
org.apache.lucene.store.FSDirectory.fileLength(FSDirectory.java:243)
org.apache.lucene.store.FilterDirectory.fileLength(FilterDirectory.java:67)
org.elasticsearch.index.store.Store$StoreStatsCache.estimateSize(Store.java:1421)
org.elasticsearch.index.store.Store$StoreStatsCache.refresh(Store.java:1410)
org.elasticsearch.index.store.Store$StoreStatsCache.refresh(Store.java:1399)
org.elasticsearch.common.util.SingleObjectCache.getOrRefresh(SingleObjectCache.java:54)
org.elasticsearch.index.store.Store.stats(Store.java:349)
org.elasticsearch.index.shard.IndexShard.storeStats(IndexShard.java:947)
org.elasticsearch.action.admin.indices.stats.CommonStats.(CommonStats.java:178)
org.elasticsearch.action.admin.indices.stats.TransportIndicesStatsAction.shardOperation(TransportIndicesStatsAction.java:164)
org.elasticsearch.action.admin.indices.stats.TransportIndicesStatsAction.shardOperation(TransportIndicesStatsAction.java:45)
org.elasticsearch.action.support.broadcast.node.TransportBroadcastByNodeAction$BroadcastByNodeTransportRequestHandler.onShardOperation(TransportBroadcastByNodeAction.java:433)
org.elasticsearch.action.support.broadcast.node.TransportBroadcastByNodeAction$BroadcastByNodeTransportRequestHandler.messageReceived(TransportBroadcastByNodeAction.java:412)
org.elasticsearch.action.support.broadcast.node.TransportBroadcastByNodeAction$BroadcastByNodeTransportRequestHandler.messageReceived(TransportBroadcastByNodeAction.java:399)
org.elasticsearch.transport.TransportRequestHandler.messageReceived(TransportRequestHandler.java:30)
org.elasticsearch.transport.RequestHandlerRegistry.processMessageReceived(RequestHandlerRegistry.java:66)
org.elasticsearch.transport.TransportService$7.doRun(TransportService.java:652)
org.elasticsearch.common.util.concurrent.ThreadContext$ContextPreservingAbstractRunnable.doRun(ThreadContext.java:637)
org.elasticsearch.common.util.concurrent.AbstractRunnable.run(AbstractRunnable.java:37)
java.util.concurrent.ThreadPoolExecutor.runWorker(ThreadPoolExecutor.java:1149)
java.util.concurrent.ThreadPoolExecutor$Worker.run(ThreadPoolExecutor.java:624)
java.lang.Thread.run(Thread.java:748)
8/10 snapshots sharing following 13 elements
org.elasticsearch.action.admin.indices.stats.TransportIndicesStatsAction.shardOperation(TransportIndicesStatsAction.java:164)
org.elasticsearch.action.admin.indices.stats.TransportIndicesStatsAction.shardOperation(TransportIndicesStatsAction.java:45)
org.elasticsearch.action.support.broadcast.node.TransportBroadcastByNodeAction$BroadcastByNodeTransportRequestHandler.onShardOperation(TransportBroadcastByNodeAction.java:433)
org.elasticsearch.action.support.broadcast.node.TransportBroadcastByNodeAction$BroadcastByNodeTransportRequestHandler.messageReceived(TransportBroadcastByNodeAction.java:412)
org.elasticsearch.action.support.broadcast.node.TransportBroadcastByNodeAction$BroadcastByNodeTransportRequestHandler.messageReceived(TransportBroadcastByNodeAction.java:399)
org.elasticsearch.transport.TransportRequestHandler.messageReceived(TransportRequestHandler.java:30)
org.elasticsearch.transport.RequestHandlerRegistry.processMessageReceived(RequestHandlerRegistry.java:66)
org.elasticsearch.transport.TransportService$7.doRun(TransportService.java:652)
org.elasticsearch.common.util.concurrent.ThreadContext$ContextPreservingAbstractRunnable.doRun(ThreadContext.java:637)
org.elasticsearch.common.util.concurrent.AbstractRunnable.run(AbstractRunnable.java:37)
java.util.concurrent.ThreadPoolExecutor.runWorker(ThreadPoolExecutor.java:1149)
java.util.concurrent.ThreadPoolExecutor$Worker.run(ThreadPoolExecutor.java:624)
java.lang.Thread.run(Thread.java:748)
63.5% (317.3ms out of 500ms) cpu usage by thread 'elasticsearch[EEvTfAV][management][T#4]'
3/10 snapshots sharing following 37 elements
java.io.UnixFileSystem.canonicalize0(Native Method)
java.io.UnixFileSystem.canonicalize(UnixFileSystem.java:172)
java.io.File.getCanonicalPath(File.java:618)
java.io.FilePermission$1.run(FilePermission.java:215)
java.io.FilePermission$1.run(FilePermission.java:203)
java.security.AccessController.doPrivileged(Native Method)
java.io.FilePermission.init(FilePermission.java:203)
java.io.FilePermission.(FilePermission.java:277)
java.lang.SecurityManager.checkRead(SecurityManager.java:888)
sun.nio.fs.UnixPath.checkRead(UnixPath.java:795)
sun.nio.fs.UnixFileAttributeViews$Basic.readAttributes(UnixFileAttributeViews.java:49)
sun.nio.fs.UnixFileSystemProvider.readAttributes(UnixFileSystemProvider.java:144)
sun.nio.fs.LinuxFileSystemProvider.readAttributes(LinuxFileSystemProvider.java:99)
java.nio.file.Files.readAttributes(Files.java:1737)
java.nio.file.Files.size(Files.java:2332)
org.apache.lucene.store.FSDirectory.fileLength(FSDirectory.java:243)
org.apache.lucene.store.FilterDirectory.fileLength(FilterDirectory.java:67)
org.elasticsearch.index.store.Store$StoreStatsCache.estimateSize(Store.java:1421)
org.elasticsearch.index.store.Store$StoreStatsCache.refresh(Store.java:1410)
```
---
### Author:  [@reedzhao](https://discuss.elastic.co/u/reedzhao)
#### Post date: [May 3, 2018, 10:11am UTC](https://discuss.elastic.co/t/es-6-1-1-server-with-small-data-goes-into-gc-loop/130340/6 "2018-05-03T10:11:43Z")
I was suspecting xpack-monitoring. Disabled the plugin, but still has GC loop problem.
---
### Author:  [@reedzhao](https://discuss.elastic.co/u/reedzhao)
#### Post date: [May 3, 2018, 10:28am UTC](https://discuss.elastic.co/t/es-6-1-1-server-with-small-data-goes-into-gc-loop/130340/7 "2018-05-03T10:28:37Z")
what is this management thread? It is slowing everything down.
```auto
::: {EEvTfAV}{EEvTfAV0QN-RBB8dGd23EA}{tUX-OsEDROyfEQXJxuNzGw}{207.38.70.156}{207.38.70.156:9300}
Hot threads at 2018-05-03T10:25:48.667Z, interval=500ms, busiestThreads=3, ignoreIdleThreads=true:
108.4% (542ms out of 500ms) cpu usage by thread 'elasticsearch[EEvTfAV][management][T#1]'
4/10 snapshots sharing following 37 elements
java.io.UnixFileSystem.canonicalize0(Native Method)
java.io.UnixFileSystem.canonicalize(UnixFileSystem.java:172)
java.io.File.getCanonicalPath(File.java:618)
java.io.FilePermission$1.run(FilePermission.java:215)
java.io.FilePermission$1.run(FilePermission.java:203)
java.security.AccessController.doPrivileged(Native Method)
java.io.FilePermission.init(FilePermission.java:203)
java.io.FilePermission.(FilePermission.java:277)
java.lang.SecurityManager.checkRead(SecurityManager.java:888)
sun.nio.fs.UnixPath.checkRead(UnixPath.java:795)
```
---
### Author:  [@DavidTurner](https://discuss.elastic.co/u/DavidTurner)
#### Post date: [May 3, 2018, 10:42am UTC](https://discuss.elastic.co/t/es-6-1-1-server-with-small-data-goes-into-gc-loop/130340/8 "2018-05-03T10:42:34Z")
I suspect [#28350](https://github.com/elastic/elasticsearch/pull/28350) (fixed in 6.1.3) although this could also be [#29125](https://github.com/elastic/elasticsearch/pull/29125) (fixed in 6.3.0, not yet released). Could you share the output of the following?
```
GET /_stats?include_segment_file_sizes&level=shards
```
---
### Author:  [@reedzhao](https://discuss.elastic.co/u/reedzhao)
#### Post date: [May 4, 2018, 1:55am UTC](https://discuss.elastic.co/t/es-6-1-1-server-with-small-data-goes-into-gc-loop/130340/9 "2018-05-04T01:55:45Z")
The output of `GET /_stats?include_segment_file_sizes&level=shards` is huge. I put it into gist.
To mitigate the problem, I have disabled monitor plugin on ES. It make things slightly better.
>
In the mean time, I increased heap to 8GB. Still have GC every 12 minutes.
It just does not make sense for 370mb of data.
```auto
2018-05-03T19:49:48.624-0400: 49690.924: [GC (Allocation Failure) 2018-05-03T19:49:48.628-0400: 49690.927: [ParNew: 1572843K->5971K(1763584K), 0.3642791 secs] 3023052K->1456320K(8192704K), 0.3700046 secs] [Times: user=5.30 sys=0.91, real=0.37 secs]
2018-05-03T20:02:40.439-0400: 50462.740: [GC (Allocation Failure) 2018-05-03T20:02:40.442-0400: 50462.742: [ParNew: 1573651K->6343K(1763584K), 0.3356468 secs] 3024000K->1456928K(8192704K), 0.3406897 secs] [Times: user=5.11 sys=0.72, real=0.34 secs]
2018-05-03T20:14:41.300-0400: 51183.600: [GC (Allocation Failure) 2018-05-03T20:14:41.302-0400: 51183.602: [ParNew: 1574023K->4659K(1763584K), 0.3448966 secs] 3024608K->1455522K(8192704K), 0.3495749 secs] [Times: user=5.14 sys=0.75, real=0.35 secs]
2018-05-03T20:25:36.236-0400: 51838.536: [GC (Allocation Failure) 2018-05-03T20:25:36.239-0400: 51838.539: [ParNew: 1572339K->7651K(1763584K), 0.4063983 secs] 3023202K->1458762K(8192704K), 0.4117208 secs] [Times: user=6.12 sys=0.72, real=0.41 secs]
2018-05-03T20:34:20.373-0400: 52362.673: [GC (Allocation Failure) 2018-05-03T20:34:20.376-0400: 52362.676: [ParNew: 1575331K->6000K(1763584K), 0.3437852 secs] 3026442K->1457170K(8192704K), 0.3495079 secs] [Times: user=5.41 sys=0.96, real=0.35 secs]
2018-05-03T20:44:38.407-0400: 52980.707: [GC (Allocation Failure) 2018-05-03T20:44:38.410-0400: 52980.710: [ParNew: 1573680K->7421K(1763584K), 0.3626231 secs] 3024850K->1458702K(8192704K), 0.3674652 secs] [Times: user=4.97 sys=1.07, real=0.36 secs]
2018-05-03T20:56:25.286-0400: 53687.586: [GC (Allocation Failure) 2018-05-03T20:56:25.289-0400: 53687.589: [ParNew: 1575101K->5596K(1763584K), 0.3359584 secs] 3026382K->1456961K(8192704K), 0.3430435 secs] [Times: user=4.77 sys=0.80, real=0.34 secs]
2018-05-03T21:04:25.369-0400: 54167.669: [GC (Allocation Failure) 2018-05-03T21:04:25.372-0400: 54167.672: [ParNew: 1573276K->7246K(1763584K), 0.3555414 secs] 3024641K->1458754K(8192704K), 0.3605436 secs] [Times: user=5.86 sys=0.71, real=0.36 secs]
```
---
### Author:  [@DavidTurner](https://discuss.elastic.co/u/DavidTurner)
#### Post date: [May 4, 2018, 7:21am UTC](https://discuss.elastic.co/t/es-6-1-1-server-with-small-data-goes-into-gc-loop/130340/10 "2018-05-04T07:21:41Z")
Thanks - at least that rules out the flush loop issues I linked previously, because all the shards have reasonable flush counts.
I'd like to return to the `hot_threads` idea. Because there's not a lot of traffic to this cluster there's a risk that any given sample misses the vital clue. Could you run a sequence of repeated samples like this, and provide the full output (probably will need a Gist too as it'll be quite long)
```
for i in `seq 10`; do curl 'http://localhost:9200/_nodes/hot_threads?threads=10'; done
```
Given that this cluster is apparently quite lightly loaded, we could try a period of much more verbose logging:
```
PUT /_cluster/settings
{"persistent":{"logger.org.elasticsearch.tasks.TaskManager":"TRACE"}}
# wait a few minutes
PUT /_cluster/settings
{"persistent":{"logger.org.elasticsearch.tasks.TaskManager":null}}
```
After this, please could you provide the logs that Elasticsearch wrote during this period.
---
### Author:  [@reedzhao](https://discuss.elastic.co/u/reedzhao)
#### Post date: [May 4, 2018, 1:34pm UTC](https://discuss.elastic.co/t/es-6-1-1-server-with-small-data-goes-into-gc-loop/130340/11 "2018-05-04T13:34:34Z")
I'll do it right away. Thanks for helping, this is driving me nuts.
Will post result in 1 hour.
```auto
#!/bin/bash
while [1=1];
do
date
curl 'http://localhost:9200/_nodes/hot_threads?threads=10'
printf "\n"
sleep 1s
done
```
---
### Author:  [@reedzhao](https://discuss.elastic.co/u/reedzhao)
#### Post date: [May 4, 2018, 2:48pm UTC](https://discuss.elastic.co/t/es-6-1-1-server-with-small-data-goes-into-gc-loop/130340/12 "2018-05-04T14:48:15Z")
Here is the ES log.
Last GC at 2018-05-04T10:36:24. I grabbed logs around that time in the gist.
>
>
GC runs like a clock, every 12 min
```auto
2018-05-04T10:12:41.273-0400: 2994.553: [GC (Allocation Failure) 2018-05-04T10:12:41.287-0400: 2994.567: [ParNew: 1596710K->33091K(1763584K), 0.7933487 secs] 2911360K->1347741K(8192704K), 0.8093607 secs] [Times: user=9.10 sys=1.85, real=0.81 secs]
2018-05-04T10:24:19.323-0400: 3692.603: [GC (Allocation Failure) 2018-05-04T10:24:19.326-0400: 3692.606: [ParNew: 1600771K->34395K(1763584K), 0.5825190 secs] 2915421K->1349045K(8192704K), 0.5889643 secs] [Times: user=9.61 sys=1.21, real=0.59 secs]
2018-05-04T10:36:24.364-0400: 4417.644: [GC (Allocation Failure) 2018-05-04T10:36:24.368-0400: 4417.648: [ParNew: 1602075K->40584K(1763584K), 0.5094672 secs] 2916725K->1355235K(8192704K), 0.5149063 secs] [Times: user=8.88 sys=0.91, real=0.52 secs]
```
---
### Author:  [@reedzhao](https://discuss.elastic.co/u/reedzhao)
#### Post date: [May 4, 2018, 3:08pm UTC](https://discuss.elastic.co/t/es-6-1-1-server-with-small-data-goes-into-gc-loop/130340/13 "2018-05-04T15:08:55Z")
Hi David, thank you so much for helping. While reading the logs, I find a lot of reference to `java.io.UnixFileSystem`. Could it be an IO issue? The server has a spinning disk, but not much is read/write to the disk.
```auto
[root@wb02 ~]# iostat
Linux 3.10.0-693.21.1.el7.x86_64 (wb02.fangintel.com) 05/04/2018 _x86_64_ (32 CPU)
avg-cpu: %user %nice %system %iowait %steal %idle
2.84 0.00 0.74 0.01 0.00 96.41
Device: tps kB_read/s kB_wrtn/s kB_read kB_wrtn
sda 18.96 36.21 220.43 4002051 24365173
dm-0 0.53 3.22 26.32 356447 2908907
dm-1 0.00 0.03 0.00 3260 0
dm-2 18.73 29.78 193.92 3291347 21435606
[root@wb02 ~]# iostat
Linux 3.10.0-693.21.1.el7.x86_64 (wb02.fangintel.com) 05/04/2018 _x86_64_ (32 CPU)
avg-cpu: %user %nice %system %iowait %steal %idle
2.84 0.00 0.74 0.01 0.00 96.41
Device: tps kB_read/s kB_wrtn/s kB_read kB_wrtn
sda 18.96 36.20 220.41 4002051 24365588
dm-0 0.53 3.22 26.31 356447 2908907
dm-1 0.00 0.03 0.00 3260 0
dm-2 18.73 29.77 193.91 3291347 21436021
[root@wb02 ~]# iostat
Linux 3.10.0-693.21.1.el7.x86_64 (wb02.fangintel.com) 05/04/2018 _x86_64_ (32 CPU)
avg-cpu: %user %nice %system %iowait %steal %idle
2.84 0.00 0.74 0.01 0.00 96.41
Device: tps kB_read/s kB_wrtn/s kB_read kB_wrtn
sda 18.96 36.20 220.42 4002051 24366410
dm-0 0.53 3.22 26.31 356447 2908907
dm-1 0.00 0.03 0.00 3260 0
dm-2 18.73 29.77 193.92 3291347 21436842
```
---
### Author:  [@DavidTurner](https://discuss.elastic.co/u/DavidTurner)
#### Post date: [May 9, 2018, 9:04am UTC](https://discuss.elastic.co/t/es-6-1-1-server-with-small-data-goes-into-gc-loop/130340/14 "2018-05-09T09:04:11Z")
Thanks. I looked through the logs and nothing immediately jumped out. Hot threads repeatedly contains StoreStatsCache#refresh(), which seems expected, and this is why there are references to `java.io.UnixFileSystem`:
```
org.elasticsearch.index.store.Store$StoreStatsCache.estimateSize(Store.java:1421)
org.elasticsearch.index.store.Store$StoreStatsCache.refresh(Store.java:1410)
org.elasticsearch.index.store.Store$StoreStatsCache.refresh(Store.java:1399)
org.elasticsearch.common.util.SingleObjectCache.getOrRefresh(SingleObjectCache.java:54)
org.elasticsearch.index.store.Store.stats(Store.java:349)
org.elasticsearch.index.shard.IndexShard.storeStats(IndexShard.java:947)
org.elasticsearch.action.admin.indices.stats.CommonStats.(CommonStats.java:178)
```
These times seem to tie in with the the stats calls in the logs:
```
$ grep logs.txt -e '\[cluster:monitor/nodes/stats\]'
[2018-05-04T10:34:27,863][TRACE][o.e.t.TaskManager] [EEvTfAV] register 50847 [transport] [cluster:monitor/nodes/stats] []
[2018-05-04T10:35:02,323][TRACE][o.e.t.TaskManager] [EEvTfAV] register 51342 [transport] [cluster:monitor/nodes/stats] []
[2018-05-04T10:35:36,793][TRACE][o.e.t.TaskManager] [EEvTfAV] register 52077 [transport] [cluster:monitor/nodes/stats] []
[2018-05-04T10:36:11,413][TRACE][o.e.t.TaskManager] [EEvTfAV] register 52450 [transport] [cluster:monitor/nodes/stats] []
[2018-05-04T10:36:46,111][TRACE][o.e.t.TaskManager] [EEvTfAV] register 52825 [transport] [cluster:monitor/nodes/stats] []
[2018-05-04T10:37:20,297][TRACE][o.e.t.TaskManager] [EEvTfAV] register 53181 [transport] [cluster:monitor/nodes/stats] []
[2018-05-04T10:37:54,422][TRACE][o.e.t.TaskManager] [EEvTfAV] register 53578 [transport] [cluster:monitor/nodes/stats] []
[2018-05-04T10:38:28,690][TRACE][o.e.t.TaskManager] [EEvTfAV] register 53962 [transport] [cluster:monitor/nodes/stats] []
```
I'm not sure I understand the issue that you're facing. The OP was about a CPU overload and spike in GCs but the last post you made shows \<3% CPU usage ...
```
avg-cpu: %user %nice %system %iowait %steal %idle
2.84 0.00 0.74 0.01 0.00 96.41
```
... and GC is taking \<1 sec every 12 minutes ...
```
2018-05-04T10:12:41.273-0400: 2994.553: [GC (Allocation Failure) 2018-05-04T10:12:41.287-0400: 2994.567: [ParNew: 1596710K->33091K(1763584K), 0.7933487 secs] 2911360K->1347741K(8192704K), 0.8093607 secs] [Times: user=9.10 sys=1.85, real=0.81 secs]
2018-05-04T10:24:19.323-0400: 3692.603: [GC (Allocation Failure) 2018-05-04T10:24:19.326-0400: 3692.606: [ParNew: 1600771K->34395K(1763584K), 0.5825190 secs] 2915421K->1349045K(8192704K), 0.5889643 secs] [Times: user=9.61 sys=1.21, real=0.59 secs]
2018-05-04T10:36:24.364-0400: 4417.644: [GC (Allocation Failure) 2018-05-04T10:36:24.368-0400: 4417.648: [ParNew: 1602075K->40584K(1763584K), 0.5094672 secs] 2916725K->1355235K(8192704K), 0.5149063 secs] [Times: user=8.88 sys=0.91, real=0.52 secs]
```
... which all seems pretty normal to me.
---
### Author:  [@reedzhao](https://discuss.elastic.co/u/reedzhao)
#### Post date: [May 9, 2018, 4:18pm UTC](https://discuss.elastic.co/t/es-6-1-1-server-with-small-data-goes-into-gc-loop/130340/15 "2018-05-09T16:18:48Z")
Hi David, thanks for the analysis.
I think stopping x-pack monitoring and increasing heap to 8GB brought down CPU utilization. Because this is a production system, I can not always try to overload CPU.
Right now, the CPU only momentarily up to 100% when GC runs. That is okay for our usage. But I believe a longer term solution would be roll out 3 node cluster with master node. That way we can easily take down nodes and experiment.
Now I have a much better understanding of how to trace ES performance. Hope this thread leaves useful information for others who has similar issue.
Cheers!
Reed
---
### Author:  [@system](https://discuss.elastic.co/u/system)
#### Post date: [June 6, 2018, 4:18pm UTC](https://discuss.elastic.co/t/es-6-1-1-server-with-small-data-goes-into-gc-loop/130340/16 "2018-06-06T16:18:51Z")
This topic was automatically closed 28 days after the last reply. New replies are no longer allowed.