# Expected fields not available in kibana visualation
**URL:** https://discuss.elastic.co/t/expected-fields-not-available-in-kibana-visualation/144256
**Category:** Kibana
**Created:** [August 13, 2018, 11:06pm UTC](https://discuss.elastic.co/t/expected-fields-not-available-in-kibana-visualation/144256 "2018-08-13T23:06:31Z")
**Posts on this page:** 6
**Page:** 1
### Author:  [@KZ\_Win](https://discuss.elastic.co/u/KZ_Win)
#### Post date: [August 13, 2018, 11:06pm UTC](https://discuss.elastic.co/t/expected-fields-not-available-in-kibana-visualation/144256/1 "2018-08-13T23:06:31Z")
I can perform a search on index pattern with range queries on certain fields and I wanted to do visualization on the same set of fields. However these fields are not available in any kind of visualization. Any idea of what I am doing wrong ? I am using kibana/elasticsearch 5.6
I can post any necessary information here.
Thanks in advance
---
### Author:  [@cjcenizal](https://discuss.elastic.co/u/cjcenizal)
#### Post date: [August 13, 2018, 11:40pm UTC](https://discuss.elastic.co/t/expected-fields-not-available-in-kibana-visualation/144256/2 "2018-08-13T23:40:53Z")
Hi there, could you share some screenshots indicating what you're seeing in Discover and Visualize?
Here are some similar threads which might also be helpful:
- [Kibana Visualize - Field not showing](https://discuss.elastic.co/t/kibana-visualize-field-not-showing/86747/2)
- [Some index string fields not appearing in visualization aggregation](https://discuss.elastic.co/t/some-index-string-fields-not-appearing-in-visualization-aggregation/71829/3)
The solution in both cases involved changing the mapping.
Thanks,
CJ
---
### Author:  [@KZ\_Win](https://discuss.elastic.co/u/KZ_Win)
#### Post date: [August 14, 2018, 2:23am UTC](https://discuss.elastic.co/t/expected-fields-not-available-in-kibana-visualation/144256/3 "2018-08-14T02:23:10Z")
Here are the relevant screenshots.
 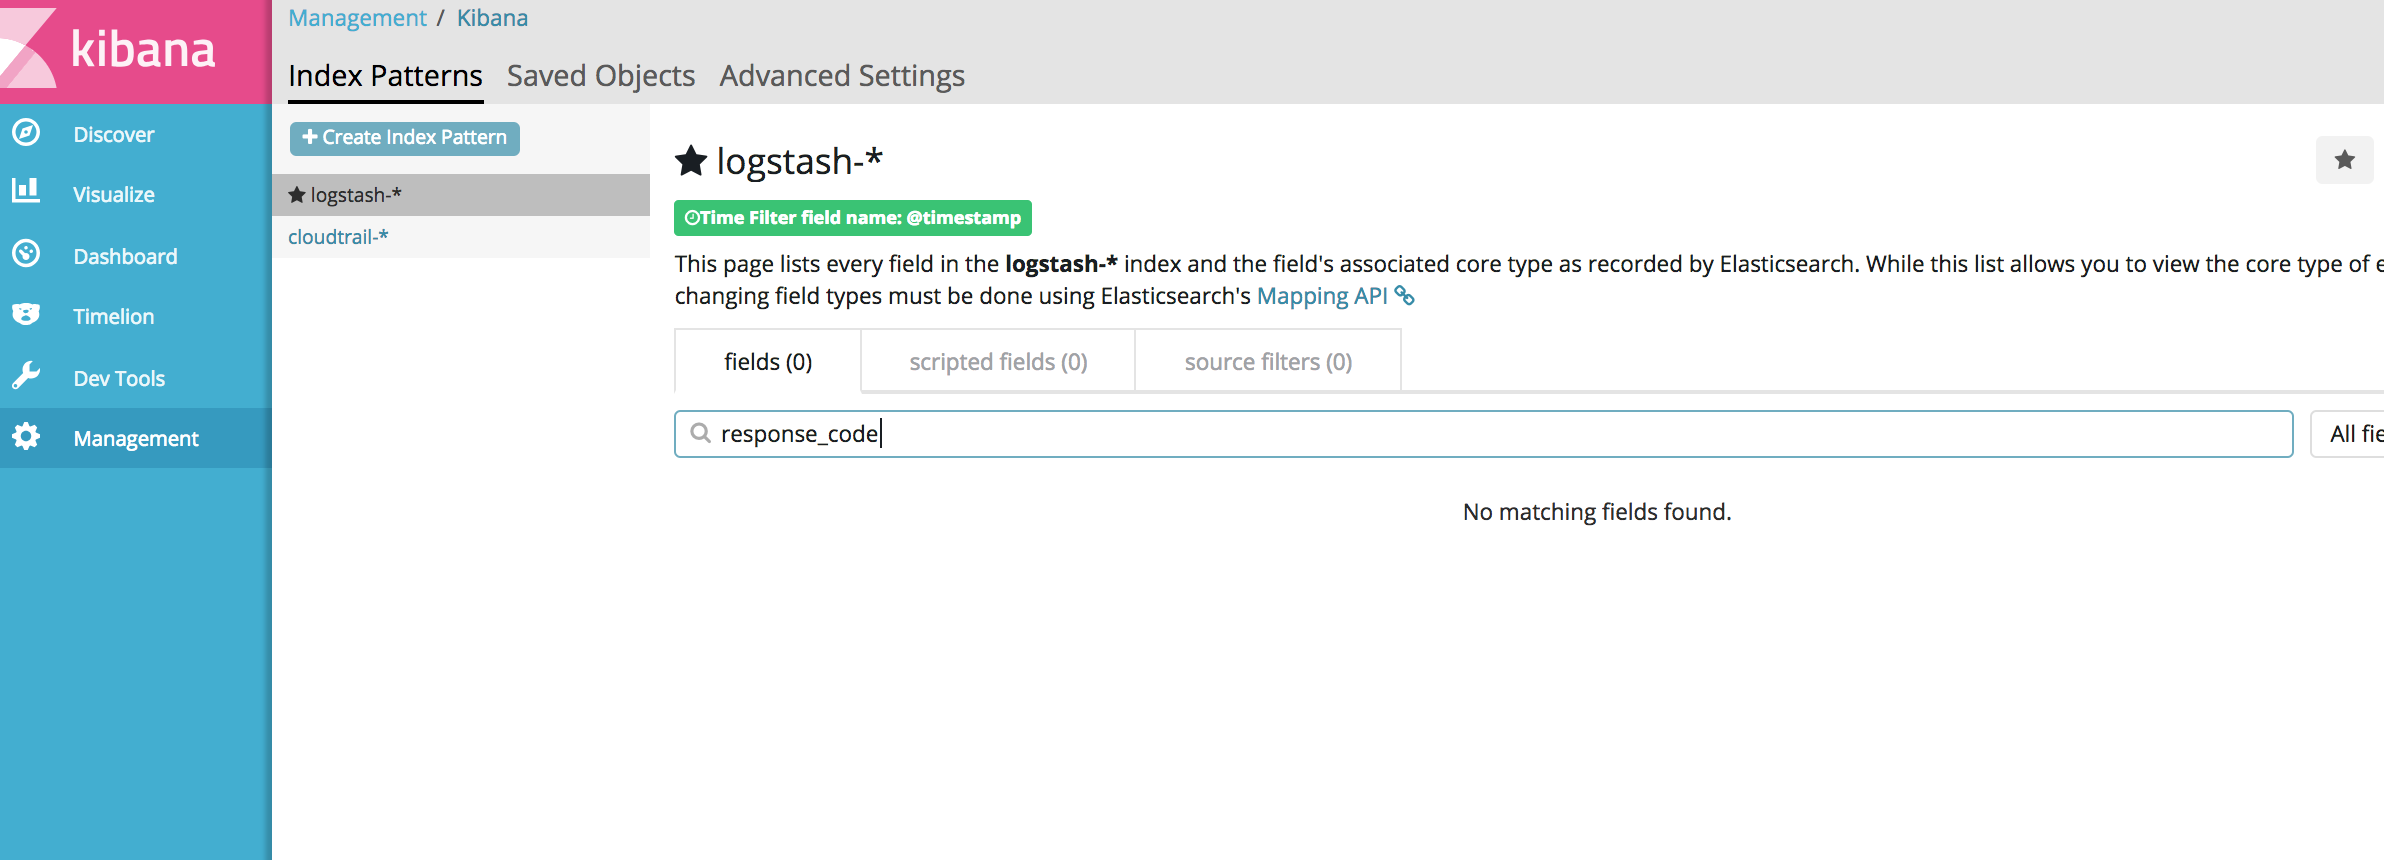 
I looked into both threads and I don't think my problem is similar to theirs.
---
### Author:  [@cjcenizal](https://discuss.elastic.co/u/cjcenizal)
#### Post date: [August 14, 2018, 9:23pm UTC](https://discuss.elastic.co/t/expected-fields-not-available-in-kibana-visualation/144256/4 "2018-08-14T21:23:45Z")
Thanks! See the question mark next to the field in Discover? That means the field mapping is of an unknown type. It needs to be of number type in order for it to be available for a range aggregation. You can try refreshing your index pattern in Management \> Index Patterns by clicking the refresh icon at the top right corner of that screen. If that doesn't resolve your problem you can try deleting the index and reindexing to create new mappings.
Please let me know if this helps.
CJ
---
### Author:  [@KZ\_Win](https://discuss.elastic.co/u/KZ_Win)
#### Post date: [August 16, 2018, 2:15pm UTC](https://discuss.elastic.co/t/expected-fields-not-available-in-kibana-visualation/144256/5 "2018-08-16T14:15:52Z")
That's very useful to know
1. That EL could not tell that this is not a number type is odd because in logstash filter there is an explicit mutation like this
```auto
convert => {
"response_code" => "integer"
"latency" => "float"
"upstream_latency" => "float"
"bytes" => "integer"
}
}
```
1. I could do proper range queries on these numbers.
2. Without doing any extra mapping configuration, I split off these types of logs into own index, in the management console these fields show up with correct types.
---
### Author:  [@system](https://discuss.elastic.co/u/system)
#### Post date: [September 13, 2018, 2:15pm UTC](https://discuss.elastic.co/t/expected-fields-not-available-in-kibana-visualation/144256/6 "2018-09-13T14:15:53Z")
This topic was automatically closed 28 days after the last reply. New replies are no longer allowed.