### Author:  [@ethical20](https://discuss.elastic.co/u/ethical20)
#### Post date: [May 24, 2023, 11:31am UTC](https://discuss.elastic.co/t/fail-to-checkin-to-fleet-server/334210/1 "2023-05-24T11:31:43Z")
Hi All,
I have successfully enrolled my remote server/machine into my Fleet server and I can see my metrics and logs coming thru.

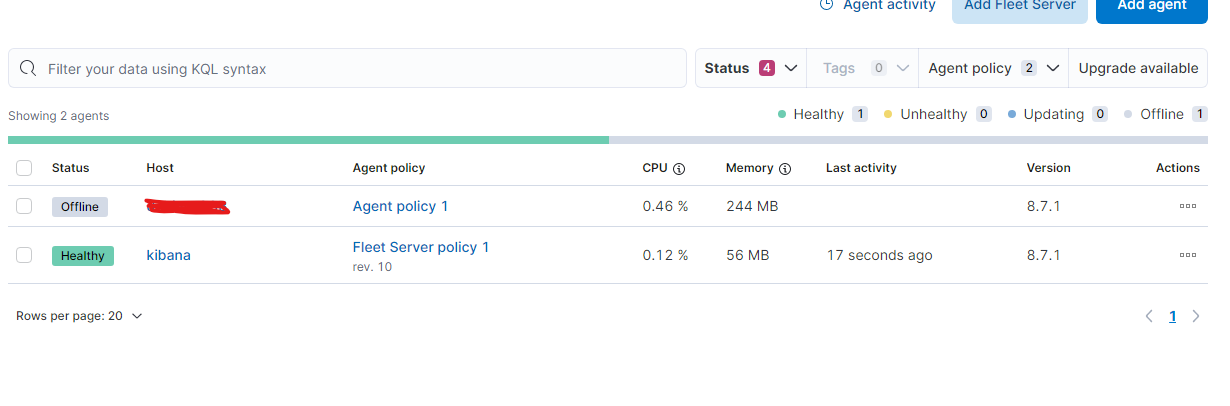
The issue is that at the beginning of the enrollment the status of the agent in kibana was `Updating` then it turned to `Offline` without ever being `Online` till now.

The fleet server is Online:
Here are the results of elastic agent status:
```auto
elastic-agent status
State: HEALTHY
Message: Running
Fleet State: FAILED
Fleet Message: fail to checkin to fleet-server: all hosts failed: 1 error occurred:
* requester 0/1 to host https://localhost:8221/ errored: Post "https://localhost:8221/api/fleet/agents/f82222be-ec5e-49e2-a584-4f9c74bcf610/checkin?": dial tcp [::1]:8221: connect: network is unreachable
Components:
* filestream (HEALTHY)
Healthy: communicating with pid '795'
* log (HEALTHY)
Healthy: communicating with pid '775'
* system/metrics (HEALTHY)
Healthy: communicating with pid '780'
* beat/metrics (HEALTHY)
Healthy: communicating with pid '785'
* http/metrics (HEALTHY)
Healthy: communicating with pid '786'
```
The error showed in the elastic agent log file `opt/Elastic/Agent/data/elastic-agent-10dc6a/logs/elastic-agent-20230524.ndjson` is this:
```auto
{"log.level":"error","@timestamp":"2023-05-24T09:34:18.986Z","log.origin":{"file.name":"fleet/fleet_gateway.go","file.line":197},"message":"Cannot checkin in with fleet-server, retrying","log":{"source":"elastic-agent"},"error":{"message":"fail to checkin to fleet-server: all hosts failed: 1 error occurred:\n\t* requester 0/1 to host https://localhost:8221/ errored: Post \"https://localhost:8221/api/fleet/agents/f82222be-ec5e-49e2-a584-..../checkin?\": dial tcp [::1]:8221: connect: network is unreachable\n\n"},"request_duration_ns":237691,"failed_checkins":100,"retry_after_ns"::553251097583,"ecs.version":"1.6.0"}
```
Why is the agent is trying to connect to port `8221` ? In the enrollment it was `8220` !
I've passed by this thread but couldn't understand or find a solution.
>
>
> \## What does this PR do?
>
> Fix an issue where the local fleet-server port was n…ot properly used by the elastic-agent when running an instance of fleet-server.
>
> \## Why is it important?
>
> When running a large scale of agents, the fleet-server may hit the connection limit if it's running on the same port as the other agents. this causes the elastic-agent running the fleet-server to be marked as degraded.
>
> \## Checklist
>
> \- \[x\] My code follows the style guidelines of this project
> \- \[x\] I have commented my code, particularly in hard-to-understand areas
> \- \[x\] I have added an entry in \`CHANGELOG.next.asciidoc\` or \`CHANGELOG-developer.next.asciidoc\`.
Your help is much appreciated.
---
### Author:  [@ethical20](https://discuss.elastic.co/u/ethical20)
#### Post date: [May 25, 2023, 7:28am UTC](https://discuss.elastic.co/t/fail-to-checkin-to-fleet-server/334210/2 "2023-05-25T07:28:01Z")
Dears @ [stephenb](https://discuss.elastic.co/u/stephenb) @ [axw](https://discuss.elastic.co/u/axw) @ [leandrojmp](https://discuss.elastic.co/u/leandrojmp)
I can see that you are the champions of the Elastic Agent support forum, actually I searched a lot in this issue with no one ever mentioned about this before.
Can you please take a look into this?
Thanks in advance and sorry for any annoyance. 🙏
---
### Author:  [@Cristina\_Amico](https://discuss.elastic.co/u/Cristina_Amico)
#### Post date: [May 25, 2023, 1:55pm UTC](https://discuss.elastic.co/t/fail-to-checkin-to-fleet-server/334210/3 "2023-05-25T13:55:08Z")
Hi @ethical20,
Could you provide the command used for the enrollment and a screenshot of the Fleet \> Settings tab?
Thanks,
Cristina
---
### Author:  [@ethical20](https://discuss.elastic.co/u/ethical20)
#### Post date: [May 25, 2023, 2:10pm UTC](https://discuss.elastic.co/t/fail-to-checkin-to-fleet-server/334210/4 "2023-05-25T14:10:36Z")
Hi @Cristina_Amico
Here is the command used for enrollment:
```auto
./elastic-agent install --url=https://IP:5045 --fleet-server-es=https://IP:5050 --fleet-server-service-token=AAEAAWVsYXN0aWMvZmxlZXQtc2VydmVyL3Rva2VuLTE2ODQ4NTUwODY5NjM6ZDMtd3VybGJTNEdXWE1.... --enrollment-token=QktyWlVvZ0I0TC16Q05jdFU0ZzM6d2VaYUtLbndTeDZpeWhTS....== --certificate-authorities=/etc/ssl/certs/elasticsearch-ca.pem
```
And here is the Fleet Setting Page:

Thanks in advance
---
### Author:  [@Cristina\_Amico](https://discuss.elastic.co/u/Cristina_Amico)
#### Post date: [May 25, 2023, 2:35pm UTC](https://discuss.elastic.co/t/fail-to-checkin-to-fleet-server/334210/5 "2023-05-25T14:35:55Z")
In the provided command to enroll the agent I see that there is an option `--fleet-server-service-token` that shouldn't be there, it should be used only when enrolling a fleet server.
```auto
./elastic-agent install \
--url=https://IP:5045 \
--fleet-server-es=https://IP:5050 \
--fleet-server-service-token=*** \
--enrollment-token=*** \
--certificate-authorities=/etc/ssl/certs/elasticsearch-ca.pem
```
There is a reference of the available commands at this link[here](https://www.elastic.co/guide/en/fleet/8.7/elastic-agent-cmd-options.html). Could you try enrolling the agent without this flag and see how it goes?
Thanks,
Cristina
---
### Author:  [@ethical20](https://discuss.elastic.co/u/ethical20)
#### Post date: [May 26, 2023, 12:35pm UTC](https://discuss.elastic.co/t/fail-to-checkin-to-fleet-server/334210/6 "2023-05-26T12:35:36Z")
> [@Cristina\_Amico](#):
>
> --fleet-server-service-token
Thanks @Cristina_Amico
I've first tried your solution and removed the `--fleet-server-service-token` and I got this error:
```auto
{"log.level":"info","@timestamp":"2023-05-26T11:15:34.180Z","log.origin":{"file.name":"cmd/enroll_cmd.go","file.line":407},"message":"Generating self-signed certificate for Fleet Server","ecs.version":"1.6.0"}
Error: invalid connection string: must include a service token
For help, please see our troubleshooting guide at https://www.elastic.co/guide/en/fleet/8.7/fleet-troubleshooting.html
Error: enroll command failed with exit code: 1
```
I then removed the` --fleet-server-es`
```auto
./elastic-agent install --url=https://IP:5045 --enrollment-token=*** --certificate-authorities=/etc/ssl/certs/elasticsearch-ca.pem
Elastic Agent will be installed at /opt/Elastic/Agent and will run as a service. Do you want to continue? [Y/n]:y
{"log.level":"info","@timestamp":"2023-05-26T11:16:40.287Z","log.origin":{"file.name":"cmd/enroll_cmd.go","file.line":475},"message":"Starting enrollment to URL: https://IP:5045/","ecs.version":"1.6.0"}
Error: fail to enroll: fail to execute request to fleet-server: dial tcp IP:5045: connect: connection refused
```
I've checked the server having the connection refused and it has the following message:
```auto
connect_to 192.68.0.7 port 8220: failed
```
I've checked my fleet server and I can see following port configs:
```auto
kibana@kibana:~$ netstat -tulpn
kibana@kibana:~$ netstat -tulpn
(Active Internet connections (only servers)
Proto Recv-Q Send-Q Local Address Foreign Address State PID/Program name
tcp 0 0 127.0.0.1:8221 0.0.0.0:* LISTEN 708/fleet-server
tcp 0 0 0.0.0.0:22 0.0.0.0:* LISTEN 669/sshd: /usr/sbin
tcp 0 0 192.168.0.7:5601 0.0.0.0:* LISTEN 611/node
tcp 0 0 127.0.0.53:53 0.0.0.0:* LISTEN 590/systemd-resolve
tcp 0 0 127.0.0.1:6791 0.0.0.0:* LISTEN 607/elastic-agent
tcp 0 0 127.0.0.1:6789 0.0.0.0:* LISTEN 607/elastic-agent
tcp6 0 0 :::22 :::* LISTEN 669/sshd: /usr/sbin
tcp6 0 0 :::8220 :::* LISTEN 708/fleet-server
udp 0 0 127.0.0.53:53 0.0.0.0:* 590/systemd-resolve
udp6 0 0 fe80::5c6b:3cff:... :::* 588/systemd-network
```
```auto
kibana@kibana:~$ sudo netstat -pln | grep 8220
tcp6 0 0 :::8220 :::* LISTEN 708/fleet-server
```
Does this mean Fleet server is listening on 8220 only for IPV6? Although Im only using IPV4.
Any clue in making fleet server listen to 8220 ?
Thanks
---
### Author:  [@MichelLaterman](https://discuss.elastic.co/u/MichelLaterman)
#### Post date: [May 30, 2023, 6:11pm UTC](https://discuss.elastic.co/t/fail-to-checkin-to-fleet-server/334210/7 "2023-05-30T18:11:15Z")
Are you intending to run a local fleet-server process on the agent?
From the context in this thread I don't think you are, so the `--fleet-server-*` flags should be removed from the install command (as you did).
In your comment, you try to enroll to `IP:5045`, is that where fleet-server is running?
Can you run `curl -v IP:5045/api/status` to verify if the server is running?
How did you bootstrap the fleet-server?
One stumbling block we have is that in order to run on a non-default port (`5045` instead of `8220`) you need to pass the `--fleet-server-port=5045` flag on installation (the `--url` option is not used to specify the port on fleet-server installation)
Finally, what is the fleet-server host in Kibana?
---
### Author:  [@ethical20](https://discuss.elastic.co/u/ethical20)
#### Post date: [June 1, 2023, 10:30am UTC](https://discuss.elastic.co/t/fail-to-checkin-to-fleet-server/334210/8 "2023-06-01T10:30:33Z")
Thanks @MichelLaterman
Please be patient about the below detailed scenario.
The kibana host you see in the below image is where I've already installed Kibana service on this local machine `https://192.168.0.7:5601` plus I've installed a Fleet server on the same machine which should be listening on `192.168.0.7:8220`
Also I have another Fleet server which is remote (not local)
Both fleet servers now are `Online` and `Healthy` .
Enrolling a local machine `192.168.0.101` to Local Fleet server `192.168.0.7` at port `8220` succussed.
**My Issue now is with agent enrollment for a remote machine on remote fleet server.**
To get out of the non default ports issue `5045` that might mislead us, my infrastructure now has the below 2 Fleet servers, (local and remote.) both on `8220`

Trying to enroll a remote machine to remote fleet server gave the below error:
```auto
~/elastic-agent-8.8.0-linux-x86_64# ./elastic-agent install --url=https://IP:8220 --enrollment-token=*** --certificate-authorities=/etc/ssl/certs/elasticsearch-ca.pem
Elastic Agent will be installed at /opt/Elastic/Agent and will run as a service. Do you want to continue? [Y/n]:y
{"log.level":"info","@timestamp":"2023-06-01T08:25:11.177Z","log.origin":{"file.name":"cmd/enroll_cmd.go","file.line":478},"message":"Starting enrollment to URL: https://IP:8220/","ecs.version":"1.6.0"}
Error: fail to enroll: fail to execute request to fleet-server: dial tcp IP:8220: connect: connection timed out
For help, please see our troubleshooting guide at https://www.elastic.co/guide/en/fleet/8.8/fleet-troubleshooting.html
```
`curl -v IP:8200/api/status` result is :
```auto
curl -v https://IP:8200/api/status
* Trying IP:8200...
* connect to IP port 8200 failed: Connection timed out
* Failed to connect to IP port 8200 after 129499 ms: Connection timed out
* Closing connection 0
curl: (28) Failed to connect to IP port 8200 after 129499 ms: Connection timed out
```
Surprisingly `curl -v https://192.16.0.7:8200/api/status` which is online and Healthy and I can enroll agent successfully gave this
```auto
* Trying 192.16.0.7:8200...
* connect to 192.16.0.7 port 8200 failed: Connection timed out
* Failed to connect to 192.16.0.7 port 8200 after 129895 ms: Connection timed out
* Closing connection 0
curl: (28) Failed to connect to 192.16.0.7 port 8200 after 129895 ms: Connection timed out
```
The only way to get a machine enrolled to the Fleet is by installing it as a Fleet server using this command:
```auto
./elastic-agent install --url=https://IP:8220 \
--fleet-server-es=https://IP:5050 \
--fleet-server-service-token=AAEAAWV*** \
--fleet-server-policy=fleet-server-policy \
--certificate-authorities=/root/certs/elasticsearch-ca.pem \
--fleet-server-es-ca=/root/certs/elasticsearch-ca.pem \
--fleet-server-cert=/root/certs/fleet-server.crt \
--fleet-server-cert-key=/root/certs/fleet-server.key
```
This is the only way I can enroll agents in Fleet, but they will have the role of a Fleet server instead of an agent.
Any help is much appreciated.
---
### Author:  [@MichelLaterman](https://discuss.elastic.co/u/MichelLaterman)
#### Post date: [June 1, 2023, 4:09pm UTC](https://discuss.elastic.co/t/fail-to-checkin-to-fleet-server/334210/9 "2023-06-01T16:09:21Z")
Are you using the argument `--url=https://IP:8220` verbatim, or `--url=https://192.168.0.7:8220`
---
### Author:  [@ethical20](https://discuss.elastic.co/u/ethical20)
#### Post date: [June 2, 2023, 8:19am UTC](https://discuss.elastic.co/t/fail-to-checkin-to-fleet-server/334210/10 "2023-06-02T08:19:28Z")
Hi @MichelLaterman
I'm using the argument `--url=https://XX.XX.XX.XX:8220` where XX.XX.XX.XX or what I'm referring to `IP` is the IP of my remote fleet server, The `--url=https://192.168.0.7:8220` I'm using it for my local machines to connect to it as a local Fleet server.
In other words:
`--url=https://RemoteIP:8220` is the Remote fleet server
and
`--url=https://192.168.0.7:8220` is my local fleet server
Hope this help, thanks in advance
---
### Author:  [@MichelLaterman](https://discuss.elastic.co/u/MichelLaterman)
#### Post date: [June 5, 2023, 8:55pm UTC](https://discuss.elastic.co/t/fail-to-checkin-to-fleet-server/334210/11 "2023-06-05T20:55:05Z")
you're listing port `8220` on Kibana and using port `8200` in curl.
---
### Author:  [@MichelLaterman](https://discuss.elastic.co/u/MichelLaterman)
#### Post date: [June 5, 2023, 9:24pm UTC](https://discuss.elastic.co/t/fail-to-checkin-to-fleet-server/334210/12 "2023-06-05T21:24:36Z")
> [@ethical20](#):
>
> Trying to enroll a remote machine to remote fleet server gave the below error:
>
> ```auto
> ~/elastic-agent-8.8.0-linux-x86_64# ./elastic-agent install --url=https://IP:8220 --enrollment-token=*** --certificate-authorities=/etc/ssl/certs/elasticsearch-ca.pem
> Elastic Agent will be installed at /opt/Elastic/Agent and will run as a service. Do you want to continue? [Y/n]:y
> {"log.level":"info","@timestamp":"2023-06-01T08:25:11.177Z","log.origin":{"file.name":"cmd/enroll_cmd.go","file.line":478},"message":"Starting enrollment to URL: https://IP:8220/","ecs.version":"1.6.0"}
> Error: fail to enroll: fail to execute request to fleet-server: dial tcp IP:8220: connect: connection timed out
> For help, please see our troubleshooting guide at https://www.elastic.co/guide/en/fleet/8.8/fleet-troubleshooting.html
>
> ```
for this issue, i would check if curl with `8220` works as expected as this looks like a network issue
---
### Author:  [@ethical20](https://discuss.elastic.co/u/ethical20)
#### Post date: [June 6, 2023, 7:36am UTC](https://discuss.elastic.co/t/fail-to-checkin-to-fleet-server/334210/13 "2023-06-06T07:36:45Z")
Thanks @MichelLaterman for getting back.
From this `netstat` can you see if there is an issue at some point? cause from my side I see everything is normal!
```auto
kibana@kibana:~$ sudo netstat -tulpn
Active Internet connections (only servers)
Proto Recv-Q Send-Q Local Address Foreign Address State PID/Program name
tcp 0 0 127.0.0.53:53 0.0.0.0:* LISTEN 597/systemd-resolve
tcp 0 0 127.0.0.1:8221 0.0.0.0:* LISTEN 1096/fleet-server
tcp 0 0 0.0.0.0:22 0.0.0.0:* LISTEN 675/sshd: /usr/sbin
tcp 0 0 127.0.0.1:6791 0.0.0.0:* LISTEN 614/elastic-agent
tcp 0 0 127.0.0.1:6789 0.0.0.0:* LISTEN 614/elastic-agent
tcp 0 0 192.168.0.7:5601 0.0.0.0:* LISTEN 618/node
tcp6 0 0 :::22 :::* LISTEN 675/sshd: /usr/sbin
tcp6 0 0 :::8220 :::* LISTEN 1096/fleet-server
udp 0 0 127.0.0.53:53 0.0.0.0:* 597/systemd-resolve
udp6 0 0 fe80::5c6b:3cff:fe6:546 :::* 595/systemd-network
```
Trying to curl from the Elasticsearch machine to the fleet server machine
```auto
elk@elk:~$ curl -v https://192.16.0.7:8200/api/status
* Trying 192.16.0.7:8200...
* connect to 192.16.0.7 port 8200 failed: Connection timed out
* Failed to connect to 192.16.0.7 port 8200 after 129411 ms: Connection timed out
* Closing connection 0
curl: (28) Failed to connect to 192.16.0.7 port 8200 after 129411 ms: Connection timed out
```
Back to fleet server...
```auto
kibana@kibana:~$ sudo netstat -pln | grep 8220
tcp6 0 0 :::8220 :::* LISTEN 1096/fleet-server
```
Shouldn't this be as below, as I understand that fleet server is using ipv6 (and I don't know why!) Is there a config file in fleet server to force it to listen on IPV4 and disable IPV6?
```auto
tcp 0.0.0.0:8220
```
Thanks in advance.
---
### Author:  [@MichelLaterman](https://discuss.elastic.co/u/MichelLaterman)
#### Post date: [June 6, 2023, 6:59pm UTC](https://discuss.elastic.co/t/fail-to-checkin-to-fleet-server/334210/14 "2023-06-06T18:59:13Z")
Once again you are using curl with port `8200` and the server should be on `8220`.
We can see (as you said) the server is running in IPv6.
Can you provide the logs from the server? or a diagnostics bundle with `elastic-agent diagnostics` from the agent managing the fleet-server?
---
### Author:  [@ethical20](https://discuss.elastic.co/u/ethical20)
#### Post date: [June 9, 2023, 10:56am UTC](https://discuss.elastic.co/t/fail-to-checkin-to-fleet-server/334210/15 "2023-06-09T10:56:17Z")
Thanks @MichelLaterman for getting back again.
Here are the logs (error and debug) for the Remote Fleet server where agents are not able to enroll to. Please note that the Real IP is changed to XX.XX.XX.XX in the below logs.
```auto
[elastic_agent][error] Checkin request to fleet-server succeeded after 125 failures
11:34:48.955
elastic_agent
[elastic_agent][error] checkin retry loop was stopped
11:35:25.381
elastic_agent
[elastic_agent][error] lazy acker: failed ack batch, enqueue for retry: [action_id: policy:fleet-server-policy:15:1, type: POLICY_CHANGE]
11:35:25.596
elastic_agent
[elastic_agent][error] Unit state changed fleet-server-default (STARTING->FAILED): Error - dial tcp XX.XX.XX.XX:5050: connect: connection refused
11:35:25.597
elastic_agent
[elastic_agent][error] Unit state changed fleet-server-default-fleet-server-fleet_server-cf05565f-4dec-4d32-b8e4-714d573be492 (STARTING->FAILED): Error - dial tcp XX.XX.XX.XX:5050: connect: connection refused
11:36:37.073
elastic_agent
[elastic_agent][error] ack retrier: commit failed with error: acknowledge 1 actions '[action_id: policy:fleet-server-policy:15:1, type: POLICY_CHANGE]' for elastic-agent 'aa84adda-aa24-40d7-8b50-fb698f5a1db5' failed: fail to ack to fleet: all hosts failed: 1 error occurred:
* requester 0/1 to host https://localhost:8221/ errored: Post "https://localhost:8221/api/fleet/agents/aa84adda-aa24-40d7-8b50-fb698f5a1db5/acks?": dial tcp [::1]:8221: connect: connection refused
11:39:46.882
elastic_agent
[elastic_agent][error] ack retrier: commit failed with error: acknowledge 1 actions '[action_id: policy:fleet-server-policy:15:1, type: POLICY_CHANGE]' for elastic-agent 'aa84adda-aa24-40d7-8b50-fb698f5a1db5' failed: fail to ack to fleet: all hosts failed: 1 error occurred:
* requester 0/1 to host https://localhost:8221/ errored: Post "https://localhost:8221/api/fleet/agents/aa84adda-aa24-40d7-8b50-fb698f5a1db5/acks?": dial tcp [::1]:8221: connect: connection refused
11:44:22.678
elastic_agent
[elastic_agent][error] ack retrier: commit failed with error: acknowledge 1 actions '[action_id: policy:fleet-server-policy:15:1, type: POLICY_CHANGE]' for elastic-agent 'aa84adda-aa24-40d7-8b50-fb698f5a1db5' failed: fail to ack to fleet: all hosts failed: 1 error occurred:
* requester 0/1 to host https://localhost:8221/ errored: Post "https://localhost:8221/api/fleet/agents/aa84adda-aa24-40d7-8b50-fb698f5a1db5/acks?": dial tcp 127.0.0.1:8221: connect: connection refused
11:50:35.393
elastic_agent
[elastic_agent][error] ack retrier: commit failed with error: acknowledge 1 actions '[action_id: policy:fleet-server-policy:15:1, type: POLICY_CHANGE]' for elastic-agent 'aa84adda-aa24-40d7-8b50-fb698f5a1db5' failed: fail to ack to fleet: all hosts failed: 1 error occurred:
* requester 0/1 to host https://localhost:8221/ errored: Post "https://localhost:8221/api/fleet/agents/aa84adda-aa24-40d7-8b50-fb698f5a1db5/acks?": dial tcp [::1]:8221: connect: connection refused
11:57:28.697
elastic_agent
[elastic_agent][error] ack retrier: commit failed with error: acknowledge 1 actions '[action_id: policy:fleet-server-policy:15:1, type: POLICY_CHANGE]' for elastic-agent 'aa84adda-aa24-40d7-8b50-fb698f5a1db5' failed: fail to ack to fleet: all hosts failed: 1 error occurred:
* requester 0/1 to host https://localhost:8221/ errored: Post "https://localhost:8221/api/fleet/agents/aa84adda-aa24-40d7-8b50-fb698f5a1db5/acks?": dial tcp [::1]:8221: connect: connection refused
12:11:17.329
elastic_agent
[elastic_agent][error] lazy acker: failed ack batch, enqueue for retry: [action_id: policy:fleet-server-policy:15:1, type: POLICY_CHANGE]
12:16:35.989
elastic_agent
[elastic_agent][error] Checkin request to fleet-server succeeded after 1 failures
12:23:15.201
elastic_agent
[elastic_agent][error] Checkin request to fleet-server succeeded after 1 failures
14:38:13.086
elastic_agent
[elastic_agent][error] Cannot checkin in with fleet-server, retrying
14:43:20.317
elastic_agent
[elastic_agent][error] Cannot checkin in with fleet-server, retrying
14:57:11.478
elastic_agent
[elastic_agent][error] Checkin request to fleet-server succeeded after 4 failures
17:13:17.215
elastic_agent
[elastic_agent][error] Cannot checkin in with fleet-server, retrying
17:20:37.555
elastic_agent
[elastic_agent][error] Cannot checkin in with fleet-server, retrying
17:29:23.939
elastic_agent
[elastic_agent][error] Cannot checkin in with fleet-server, retrying
17:38:00.709
elastic_agent
[elastic_agent][error] Cannot checkin in with fleet-server, retrying
17:50:24.945
elastic_agent
[elastic_agent][error] Checkin request to fleet-server succeeded after 6 failures
17:54:24.532
elastic_agent
[elastic_agent][debug] running checks using 'DBus' controller
17:54:24.533
elastic_agent
[elastic_agent][debug] Error checker started
17:54:24.533
elastic_agent
[elastic_agent][debug] Crash checker started
17:54:24.533
elastic_agent
[elastic_agent][debug] watcher having PID: 3656
17:54:25.397
elastic_agent
[elastic_agent][error] lazy acker: failed ack batch, enqueue for retry: [action_id: 2be7dc2e-cf55-4bc3-826a-a46852b3d2ec, type: UPGRADE]
17:54:27.223
elastic_agent
[elastic_agent][error] lazy acker: failed ack batch, enqueue for retry: [action_id: policy:fleet-server-policy:16:1, type: POLICY_CHANGE]
17:54:34.535
elastic_agent
[elastic_agent][debug] retrieved service PID [418] changed 1 times within 6
17:54:34.535
elastic_agent
[elastic_agent][debug] watcher having PID: 3656
17:54:44.537
elastic_agent
[elastic_agent][debug] retrieved service PID [418] changed 1 times within 6
17:54:44.537
elastic_agent
[elastic_agent][debug] watcher having PID: 3656
17:54:54.538
elastic_agent
[elastic_agent][debug] retrieved service PID [418] changed 1 times within 6
17:54:54.538
elastic_agent
[elastic_agent][debug] watcher having PID: 3656
17:55:04.539
elastic_agent
[elastic_agent][debug] retrieved service PID [418] changed 1 times within 6
17:55:04.539
elastic_agent
[elastic_agent][debug] watcher having PID: 3656
17:55:14.541
elastic_agent
[elastic_agent][debug] retrieved service PID [418] changed 1 times within 6
17:55:14.541
elastic_agent
[elastic_agent][debug] watcher having PID: 3656
17:55:24.542
elastic_agent
[elastic_agent][debug] retrieved service PID [418] changed 1 times within 6
17:55:24.542
elastic_agent
[elastic_agent][debug] watcher having PID: 3656
17:55:34.543
elastic_agent
[elastic_agent][debug] retrieved service PID [418] changed 1 times within 6
17:55:34.543
elastic_agent
[elastic_agent][debug] watcher having PID: 3656
17:55:44.544
elastic_agent
[elastic_agent][debug] retrieved service PID [418] changed 1 times within 6
17:55:44.544
elastic_agent
[elastic_agent][debug] watcher having PID: 3656
17:55:54.546
elastic_agent
[elastic_agent][debug] retrieved service PID [418] changed 1 times within 6
17:55:54.546
elastic_agent
[elastic_agent][debug] watcher having PID: 3656
17:56:04.547
elastic_agent
[elastic_agent][debug] retrieved service PID [418] changed 1 times within 6
17:56:04.547
elastic_agent
[elastic_agent][debug] watcher having PID: 3656
17:56:14.548
elastic_agent
[elastic_agent][debug] retrieved service PID [418] changed 1 times within 6
17:56:14.548
elastic_agent
[elastic_agent][debug] watcher having PID: 3656
17:56:24.550
elastic_agent
[elastic_agent][debug] retrieved service PID [418] changed 1 times within 6
17:56:24.550
elastic_agent
[elastic_agent][debug] watcher having PID: 3656
17:56:34.551
elastic_agent
[elastic_agent][debug] retrieved service PID [418] changed 1 times within 6
17:56:34.551
elastic_agent
[elastic_agent][debug] watcher having PID: 3656
17:56:44.552
elastic_agent
[elastic_agent][debug] retrieved service PID [418] changed 1 times within 6
17:56:44.552
elastic_agent
[elastic_agent][debug] watcher having PID: 3656
17:56:54.554
elastic_agent
[elastic_agent][debug] retrieved service PID [418] changed 1 times within 6
17:56:54.554
elastic_agent
[elastic_agent][debug] watcher having PID: 3656
17:57:04.555
elastic_agent
[elastic_agent][debug] retrieved service PID [418] changed 1 times within 6
17:57:04.555
elastic_agent
[elastic_agent][debug] watcher having PID: 3656
17:57:14.556
elastic_agent
[elastic_agent][debug] retrieved service PID [418] changed 1 times within 6
17:57:14.556
elastic_agent
[elastic_agent][debug] watcher having PID: 3656
17:57:24.558
elastic_agent
[elastic_agent][debug] retrieved service PID [418] changed 1 times within 6
17:57:24.558
elastic_agent
[elastic_agent][debug] watcher having PID: 3656
17:57:34.559
elastic_agent
[elastic_agent][debug] retrieved service PID [418] changed 1 times within 6
17:57:34.559
elastic_agent
[elastic_agent][debug] watcher having PID: 3656
17:57:44.561
elastic_agent
[elastic_agent][debug] retrieved service PID [418] changed 1 times within 6
17:57:44.561
elastic_agent
[elastic_agent][debug] watcher having PID: 3656
17:57:54.562
elastic_agent
[elastic_agent][debug] retrieved service PID [418] changed 1 times within 6
17:57:54.563
elastic_agent
[elastic_agent][debug] watcher having PID: 3656
17:58:04.564
elastic_agent
[elastic_agent][debug] retrieved service PID [418] changed 1 times within 6
17:58:04.564
elastic_agent
[elastic_agent][debug] watcher having PID: 3656
17:58:14.565
elastic_agent
[elastic_agent][debug] retrieved service PID [418] changed 1 times within 6
17:58:14.565
elastic_agent
[elastic_agent][debug] watcher having PID: 3656
17:58:24.566
elastic_agent
[elastic_agent][debug] retrieved service PID [418] changed 1 times within 6
17:58:24.566
elastic_agent
[elastic_agent][debug] watcher having PID: 3656
17:58:34.568
elastic_agent
[elastic_agent][debug] retrieved service PID [418] changed 1 times within 6
17:58:34.568
elastic_agent
[elastic_agent][debug] watcher having PID: 3656
17:58:44.569
elastic_agent
[elastic_agent][debug] retrieved service PID [418] changed 1 times within 6
17:58:44.569
elastic_agent
[elastic_agent][debug] watcher having PID: 3656
17:58:54.571
elastic_agent
[elastic_agent][debug] retrieved service PID [418] changed 1 times within 6
17:58:54.571
elastic_agent
[elastic_agent][debug] watcher having PID: 3656
17:59:04.572
elastic_agent
[elastic_agent][debug] retrieved service PID [418] changed 1 times within 6
17:59:04.573
elastic_agent
[elastic_agent][debug] watcher having PID: 3656
17:59:14.574
elastic_agent
[elastic_agent][debug] retrieved service PID [418] changed 1 times within 6
17:59:14.574
elastic_agent
[elastic_agent][debug] watcher having PID: 3656
17:59:24.575
elastic_agent
[elastic_agent][debug] retrieved service PID [418] changed 1 times within 6
17:59:24.576
elastic_agent
[elastic_agent][debug] watcher having PID: 3656
17:59:34.577
elastic_agent
[elastic_agent][debug] retrieved service PID [418] changed 1 times within 6
17:59:34.577
elastic_agent
[elastic_agent][debug] watcher having PID: 3656
17:59:44.578
elastic_agent
[elastic_agent][debug] retrieved service PID [418] changed 1 times within 6
17:59:44.578
elastic_agent
[elastic_agent][debug] watcher having PID: 3656
17:59:54.579
elastic_agent
[elastic_agent][debug] retrieved service PID [418] changed 1 times within 6
17:59:54.580
elastic_agent
[elastic_agent][debug] watcher having PID: 3656
18:00:04.581
elastic_agent
[elastic_agent][debug] retrieved service PID [418] changed 1 times within 6
18:00:04.581
elastic_agent
[elastic_agent][debug] watcher having PID: 3656
18:00:14.582
elastic_agent
[elastic_agent][debug] retrieved service PID [418] changed 1 times within 6
18:00:14.582
elastic_agent
[elastic_agent][debug] watcher having PID: 3656
18:00:24.584
elastic_agent
[elastic_agent][debug] retrieved service PID [418] changed 1 times within 6
18:00:24.584
elastic_agent
[elastic_agent][debug] watcher having PID: 3656
18:00:34.585
elastic_agent
[elastic_agent][debug] retrieved service PID [418] changed 1 times within 6
18:00:34.585
elastic_agent
[elastic_agent][debug] watcher having PID: 3656
18:00:44.587
elastic_agent
[elastic_agent][debug] retrieved service PID [418] changed 1 times within 6
18:00:44.587
elastic_agent
[elastic_agent][debug] watcher having PID: 3656
18:00:54.589
elastic_agent
[elastic_agent][debug] retrieved service PID [418] changed 1 times within 6
18:00:54.589
elastic_agent
[elastic_agent][debug] watcher having PID: 3656
18:01:04.591
elastic_agent
[elastic_agent][debug] retrieved service PID [418] changed 1 times within 6
18:01:04.591
elastic_agent
[elastic_agent][debug] watcher having PID: 3656
18:01:14.592
elastic_agent
[elastic_agent][debug] retrieved service PID [418] changed 1 times within 6
18:01:14.592
elastic_agent
[elastic_agent][debug] watcher having PID: 3656
18:01:24.593
elastic_agent
[elastic_agent][debug] retrieved service PID [418] changed 1 times within 6
18:01:24.593
elastic_agent
[elastic_agent][debug] watcher having PID: 3656
18:01:34.594
elastic_agent
[elastic_agent][debug] retrieved service PID [418] changed 1 times within 6
18:01:34.594
elastic_agent
[elastic_agent][debug] watcher having PID: 3656
18:01:44.595
elastic_agent
[elastic_agent][debug] retrieved service PID [418] changed 1 times within 6
18:01:44.595
elastic_agent
[elastic_agent][debug] watcher having PID: 3656
18:01:54.597
elastic_agent
[elastic_agent][debug] retrieved service PID [418] changed 1 times within 6
18:01:54.597
elastic_agent
[elastic_agent][debug] watcher having PID: 3656
18:02:04.598
elastic_agent
[elastic_agent][debug] retrieved service PID [418] changed 1 times within 6
18:02:04.598
elastic_agent
[elastic_agent][debug] watcher having PID: 3656
18:02:14.599
elastic_agent
[elastic_agent][debug] retrieved service PID [418] changed 1 times within 6
18:02:14.599
elastic_agent
[elastic_agent][debug] watcher having PID: 3656
18:02:24.600
elastic_agent
[elastic_agent][debug] retrieved service PID [418] changed 1 times within 6
18:02:24.600
elastic_agent
[elastic_agent][debug] watcher having PID: 3656
18:02:34.601
elastic_agent
[elastic_agent][debug] retrieved service PID [418] changed 1 times within 6
18:02:34.602
elastic_agent
[elastic_agent][debug] watcher having PID: 3656
18:02:44.603
elastic_agent
[elastic_agent][debug] retrieved service PID [418] changed 1 times within 6
18:02:44.603
elastic_agent
[elastic_agent][debug] watcher having PID: 3656
18:02:54.605
elastic_agent
[elastic_agent][debug] retrieved service PID [418] changed 1 times within 6
18:02:54.605
elastic_agent
[elastic_agent][debug] watcher having PID: 3656
18:03:04.609
elastic_agent
[elastic_agent][debug] retrieved service PID [418] changed 1 times within 6
18:03:04.609
elastic_agent
[elastic_agent][debug] watcher having PID: 3656
18:03:14.610
elastic_agent
[elastic_agent][debug] retrieved service PID [418] changed 1 times within 6
18:03:14.610
elastic_agent
[elastic_agent][debug] watcher having PID: 3656
18:03:24.612
elastic_agent
[elastic_agent][debug] retrieved service PID [418] changed 1 times within 6
18:03:24.612
elastic_agent
[elastic_agent][debug] watcher having PID: 3656
18:03:34.613
elastic_agent
[elastic_agent][debug] retrieved service PID [418] changed 1 times within 6
18:03:34.613
elastic_agent
[elastic_agent][debug] watcher having PID: 3656
18:03:44.614
elastic_agent
[elastic_agent][debug] retrieved service PID [418] changed 1 times within 6
18:03:44.614
elastic_agent
[elastic_agent][debug] watcher having PID: 3656
18:03:54.617
elastic_agent
[elastic_agent][debug] retrieved service PID [418] changed 1 times within 6
18:03:54.617
elastic_agent
[elastic_agent][debug] watcher having PID: 3656
18:04:04.618
elastic_agent
[elastic_agent][debug] retrieved service PID [418] changed 1 times within 6
18:04:04.618
elastic_agent
[elastic_agent][debug] watcher having PID: 3656
18:04:14.619
elastic_agent
[elastic_agent][debug] retrieved service PID [418] changed 1 times within 6
18:04:14.619
elastic_agent
[elastic_agent][debug] watcher having PID: 3656
18:04:22.216
elastic_agent
[elastic_agent][debug] Cleaning up upgrade
18:04:24.216
elastic_agent
[elastic_agent][debug] Removing marker file
18:04:24.220
elastic_agent
[elastic_agent][debug] Removing previous symlink path
18:04:24.220
elastic_agent
[elastic_agent][debug] Removing hashed data directory
May 30, 2023
09:33:21.562
elastic_agent
[elastic_agent][error] Cannot checkin in with fleet-server, retrying
09:37:54.060
elastic_agent
[elastic_agent][error] Cannot checkin in with fleet-server, retrying
09:51:09.912
elastic_agent
[elastic_agent][error] Checkin request to fleet-server succeeded after 4 failures
May 31, 2023
11:09:14.793
elastic_agent
[elastic_agent][debug] update marker not present at '/opt/Elastic/Agent/data'
11:09:18.909
elastic_agent
[elastic_agent][error] lazy acker: failed ack batch, enqueue for retry: [action_id: policy:fleet-server-policy:17:1, type: POLICY_CHANGE]
11:09:19.180
elastic_agent
[elastic_agent][error] Unit state changed fleet-server-default-fleet-server-fleet_server-cf05565f-4dec-4d32-b8e4-714d573be492 (STARTING->FAILED): Error - dial tcp XX.XX.XX.XX:5050: connect: connection refused
11:09:19.180
elastic_agent
[elastic_agent][error] Unit state changed fleet-server-default (STARTING->FAILED): Error - dial tcp XX.XX.XX.XX:5050: connect: connection refused
11:10:47.797
elastic_agent
[elastic_agent][error] ack retrier: commit failed with error: acknowledge 1 actions '[action_id: policy:fleet-server-policy:17:1, type: POLICY_CHANGE]' for elastic-agent 'aa84adda-aa24-40d7-8b50-fb698f5a1db5' failed: fail to ack to fleet: all hosts failed: 1 error occurred:
* requester 0/1 to host https://localhost:8221/ errored: Post "https://localhost:8221/api/fleet/agents/aa84adda-aa24-40d7-8b50-fb698f5a1db5/acks?": dial tcp 127.0.0.1:8221: connect: connection refused
11:13:42.038
elastic_agent
[elastic_agent][error] ack retrier: commit failed with error: acknowledge 1 actions '[action_id: policy:fleet-server-policy:17:1, type: POLICY_CHANGE]' for elastic-agent 'aa84adda-aa24-40d7-8b50-fb698f5a1db5' failed: fail to ack to fleet: all hosts failed: 1 error occurred:
* requester 0/1 to host https://localhost:8221/ errored: Post "https://localhost:8221/api/fleet/agents/aa84adda-aa24-40d7-8b50-fb698f5a1db5/acks?": dial tcp 127.0.0.1:8221: connect: connection refused
11:17:34.219
elastic_agent
[elastic_agent][error] ack retrier: commit failed with error: acknowledge 1 actions '[action_id: policy:fleet-server-policy:17:1, type: POLICY_CHANGE]' for elastic-agent 'aa84adda-aa24-40d7-8b50-fb698f5a1db5' failed: fail to ack to fleet: all hosts failed: 1 error occurred:
* requester 0/1 to host https://localhost:8221/ errored: Post "https://localhost:8221/api/fleet/agents/aa84adda-aa24-40d7-8b50-fb698f5a1db5/acks?": dial tcp 127.0.0.1:8221: connect: connection refused
11:23:22.735
elastic_agent
[elastic_agent][error] ack retrier: commit failed with error: acknowledge 1 actions '[action_id: policy:fleet-server-policy:17:1, type: POLICY_CHANGE]' for elastic-agent 'aa84adda-aa24-40d7-8b50-fb698f5a1db5' failed: fail to ack to fleet: all hosts failed: 1 error occurred:
* requester 0/1 to host https://localhost:8221/ errored: Post "https://localhost:8221/api/fleet/agents/aa84adda-aa24-40d7-8b50-fb698f5a1db5/acks?": dial tcp 127.0.0.1:8221: connect: connection refused
11:28:39.817
elastic_agent
[elastic_agent][error] ack retrier: commit failed with error: acknowledge 1 actions '[action_id: policy:fleet-server-policy:17:1, type: POLICY_CHANGE]' for elastic-agent 'aa84adda-aa24-40d7-8b50-fb698f5a1db5' failed: fail to ack to fleet: all hosts failed: 1 error occurred:
* requester 0/1 to host https://localhost:8221/ errored: Post "https://localhost:8221/api/fleet/agents/aa84adda-aa24-40d7-8b50-fb698f5a1db5/acks?": dial tcp [::1]:8221: connect: connection refused
14:57:09.277
elastic_agent
[elastic_agent][debug] update marker not present at '/opt/Elastic/Agent/data'
14:57:11.685
elastic_agent
[elastic_agent][error] lazy acker: failed ack batch, enqueue for retry: [action_id: policy:fleet-server-policy:17:1, type: POLICY_CHANGE]
14:58:58.066
elastic_agent
[elastic_agent][error] ack retrier: commit failed with error: acknowledge 1 actions '[action_id: policy:fleet-server-policy:17:1, type: POLICY_CHANGE]' for elastic-agent 'aa84adda-aa24-40d7-8b50-fb698f5a1db5' failed: fail to ack to fleet: all hosts failed: 1 error occurred:
* requester 0/1 to host https://localhost:8221/ errored: Post "https://localhost:8221/api/fleet/agents/aa84adda-aa24-40d7-8b50-fb698f5a1db5/acks?": dial tcp [::1]:8221: connect: connection refused
15:04:52.788
elastic_agent
[elastic_agent][error] ack retrier: commit failed with error: acknowledge 1 actions '[action_id: policy:fleet-server-policy:17:1, type: POLICY_CHANGE]' for elastic-agent 'aa84adda-aa24-40d7-8b50-fb698f5a1db5' failed: fail to ack to fleet: all hosts failed: 1 error occurred:
* requester 0/1 to host https://localhost:8221/ errored: Post "https://localhost:8221/api/fleet/agents/aa84adda-aa24-40d7-8b50-fb698f5a1db5/acks?": read tcp 127.0.0.1:43696->127.0.0.1:8221: read: connection reset by peer
15:11:09.623
elastic_agent
[elastic_agent][error] ack retrier: commit failed with error: acknowledge 1 actions '[action_id: policy:fleet-server-policy:17:1, type: POLICY_CHANGE]' for elastic-agent 'aa84adda-aa24-40d7-8b50-fb698f5a1db5' failed: fail to ack to fleet: all hosts failed: 1 error occurred:
* requester 0/1 to host https://localhost:8221/ errored: Post "https://localhost:8221/api/fleet/agents/aa84adda-aa24-40d7-8b50-fb698f5a1db5/acks?": read tcp 127.0.0.1:38122->127.0.0.1:8221: read: connection reset by peer
15:17:24.416
elastic_agent
[elastic_agent][error] ack retrier: commit failed with error: acknowledge 1 actions '[action_id: policy:fleet-server-policy:17:1, type: POLICY_CHANGE]' for elastic-agent 'aa84adda-aa24-40d7-8b50-fb698f5a1db5' failed: fail to ack to fleet: all hosts failed: 1 error occurred:
* requester 0/1 to host https://localhost:8221/ errored: Post "https://localhost:8221/api/fleet/agents/aa84adda-aa24-40d7-8b50-fb698f5a1db5/acks?": read tcp 127.0.0.1:60022->127.0.0.1:8221: read: connection reset by peer
15:25:38.163
elastic_agent
[elastic_agent][error] ack retrier: commit failed with error: acknowledge 1 actions '[action_id: policy:fleet-server-policy:17:1, type: POLICY_CHANGE]' for elastic-agent 'aa84adda-aa24-40d7-8b50-fb698f5a1db5' failed: fail to ack to fleet: all hosts failed: 1 error occurred:
* requester 0/1 to host https://localhost:8221/ errored: Post "https://localhost:8221/api/fleet/agents/aa84adda-aa24-40d7-8b50-fb698f5a1db5/acks?": read tcp 127.0.0.1:34768->127.0.0.1:8221: read: connection reset by peer
15:27:51.618
elastic_agent
[elastic_agent][debug] update marker not present at '/opt/Elastic/Agent/data'
15:30:04.429
elastic_agent
[elastic_agent][error] lazy acker: failed ack batch, enqueue for retry: [action_id: policy:fleet-server-policy:17:1, type: POLICY_CHANGE]
15:33:59.953
elastic_agent
[elastic_agent][error] ack retrier: commit failed with error: acknowledge 1 actions '[action_id: policy:fleet-server-policy:17:1, type: POLICY_CHANGE]' for elastic-agent 'aa84adda-aa24-40d7-8b50-fb698f5a1db5' failed: fail to ack to fleet: all hosts failed: 1 error occurred:
* requester 0/1 to host https://localhost:8221/ errored: Post "https://localhost:8221/api/fleet/agents/aa84adda-aa24-40d7-8b50-fb698f5a1db5/acks?": read tcp 127.0.0.1:58666->127.0.0.1:8221: read: connection reset by peer
15:38:26.191
elastic_agent
[elastic_agent][error] ack retrier: commit failed with error: acknowledge 1 actions '[action_id: policy:fleet-server-policy:17:1, type: POLICY_CHANGE]' for elastic-agent 'aa84adda-aa24-40d7-8b50-fb698f5a1db5' failed: fail to ack to fleet: all hosts failed: 1 error occurred:
* requester 0/1 to host https://localhost:8221/ errored: Post "https://localhost:8221/api/fleet/agents/aa84adda-aa24-40d7-8b50-fb698f5a1db5/acks?": read tcp 127.0.0.1:51102->127.0.0.1:8221: read: connection reset by peer
15:46:11.083
elastic_agent
[elastic_agent][error] ack retrier: commit failed with error: acknowledge 1 actions '[action_id: policy:fleet-server-policy:17:1, type: POLICY_CHANGE]' for elastic-agent 'aa84adda-aa24-40d7-8b50-fb698f5a1db5' failed: fail to ack to fleet: all hosts failed: 1 error occurred:
* requester 0/1 to host https://localhost:8221/ errored: Post "https://localhost:8221/api/fleet/agents/aa84adda-aa24-40d7-8b50-fb698f5a1db5/acks?": read tcp 127.0.0.1:37512->127.0.0.1:8221: read: connection reset by peer
15:53:55.995
elastic_agent
[elastic_agent][error] ack retrier: commit failed with error: acknowledge 1 actions '[action_id: policy:fleet-server-policy:17:1, type: POLICY_CHANGE]' for elastic-agent 'aa84adda-aa24-40d7-8b50-fb698f5a1db5' failed: fail to ack to fleet: all hosts failed: 1 error occurred:
* requester 0/1 to host https://localhost:8221/ errored: Post "https://localhost:8221/api/fleet/agents/aa84adda-aa24-40d7-8b50-fb698f5a1db5/acks?": read tcp [::1]:50792->[::1]:8221: read: connection reset by peer
16:02:40.284
elastic_agent
[elastic_agent][error] ack retrier: commit failed with error: acknowledge 1 actions '[action_id: policy:fleet-server-policy:17:1, type: POLICY_CHANGE]' for elastic-agent 'aa84adda-aa24-40d7-8b50-fb698f5a1db5' failed: fail to ack to fleet: all hosts failed: 1 error occurred:
* requester 0/1 to host https://localhost:8221/ errored: Post "https://localhost:8221/api/fleet/agents/aa84adda-aa24-40d7-8b50-fb698f5a1db5/acks?": read tcp 127.0.0.1:48490->127.0.0.1:8221: read: connection reset by peer
Jun 1, 2023
09:42:14.832
elastic_agent
[elastic_agent][debug] update marker not present at '/opt/Elastic/Agent/data'
09:42:18.021
elastic_agent
[elastic_agent][error] lazy acker: failed ack batch, enqueue for retry: [action_id: policy:fleet-server-policy:17:1, type: POLICY_CHANGE]
09:42:18.467
elastic_agent
[elastic_agent][error] Unit state changed fleet-server-default-fleet-server-fleet_server-cf05565f-4dec-4d32-b8e4-714d573be492 (STARTING->FAILED): Error - dial tcp XX.XX.XX.XX:5050: connect: connection refused
09:42:18.467
elastic_agent
[elastic_agent][error] Unit state changed fleet-server-default (STARTING->FAILED): Error - dial tcp XX.XX.XX.XX:5050: connect: connection refused
09:43:32.686
elastic_agent
[elastic_agent][error] ack retrier: commit failed with error: acknowledge 1 actions '[action_id: policy:fleet-server-policy:17:1, type: POLICY_CHANGE]' for elastic-agent 'aa84adda-aa24-40d7-8b50-fb698f5a1db5' failed: fail to ack to fleet: all hosts failed: 1 error occurred:
* requester 0/1 to host https://localhost:8221/ errored: Post "https://localhost:8221/api/fleet/agents/aa84adda-aa24-40d7-8b50-fb698f5a1db5/acks?": dial tcp [::1]:8221: connect: connection refused
09:47:01.135
elastic_agent
[elastic_agent][error] ack retrier: commit failed with error: acknowledge 1 actions '[action_id: policy:fleet-server-policy:17:1, type: POLICY_CHANGE]' for elastic-agent 'aa84adda-aa24-40d7-8b50-fb698f5a1db5' failed: fail to ack to fleet: all hosts failed: 1 error occurred:
* requester 0/1 to host https://localhost:8221/ errored: Post "https://localhost:8221/api/fleet/agents/aa84adda-aa24-40d7-8b50-fb698f5a1db5/acks?": dial tcp [::1]:8221: connect: connection refused
09:50:32.487
elastic_agent
[elastic_agent][error] lazy acker: failed ack batch, enqueue for retry: [action_id: policy:fleet-server-policy:17:1, type: POLICY_CHANGE]
Jun 2, 2023
10:51:50.252
elastic_agent
[elastic_agent][debug] update marker not present at '/opt/Elastic/Agent/data'
11:02:55.472
elastic_agent
[elastic_agent][error] lazy acker: failed ack batch, enqueue for retry: [action_id: policy:fleet-server-policy:17:1, type: POLICY_CHANGE]
11:02:55.780
elastic_agent
[elastic_agent][error] Unit state changed fleet-server-default-fleet-server-fleet_server-cf05565f-4dec-4d32-b8e4-714d573be492 (STARTING->FAILED): Error - dial tcp XX.XX.XX.XX:5050: connect: connection refused
11:02:55.780
elastic_agent
[elastic_agent][error] Unit state changed fleet-server-default (STARTING->FAILED): Error - dial tcp XX.XX.XX.XX:5050: connect: connection refused
11:03:57.472
elastic_agent
[elastic_agent][error] ack retrier: commit failed with error: acknowledge 1 actions '[action_id: policy:fleet-server-policy:17:1, type: POLICY_CHANGE]' for elastic-agent 'aa84adda-aa24-40d7-8b50-fb698f5a1db5' failed: fail to ack to fleet: all hosts failed: 1 error occurred:
* requester 0/1 to host https://localhost:8221/ errored: Post "https://localhost:8221/api/fleet/agents/aa84adda-aa24-40d7-8b50-fb698f5a1db5/acks?": dial tcp 127.0.0.1:8221: connect: connection refused
11:06:27.012
elastic_agent
[elastic_agent][error] ack retrier: commit failed with error: acknowledge 1 actions '[action_id: policy:fleet-server-policy:17:1, type: POLICY_CHANGE]' for elastic-agent 'aa84adda-aa24-40d7-8b50-fb698f5a1db5' failed: fail to ack to fleet: all hosts failed: 1 error occurred:
* requester 0/1 to host https://localhost:8221/ errored: Post "https://localhost:8221/api/fleet/agents/aa84adda-aa24-40d7-8b50-fb698f5a1db5/acks?": dial tcp [::1]:8221: connect: connection refused
11:10:44.821
elastic_agent
[elastic_agent][error] ack retrier: commit failed with error: acknowledge 1 actions '[action_id: policy:fleet-server-policy:17:1, type: POLICY_CHANGE]' for elastic-agent 'aa84adda-aa24-40d7-8b50-fb698f5a1db5' failed: fail to ack to fleet: all hosts failed: 1 error occurred:
* requester 0/1 to host https://localhost:8221/ errored: Post "https://localhost:8221/api/fleet/agents/aa84adda-aa24-40d7-8b50-fb698f5a1db5/acks?": dial tcp 127.0.0.1:8221: connect: connection refused
11:14:50.233
elastic_agent
[elastic_agent][error] lazy acker: failed ack batch, enqueue for retry: [action_id: policy:fleet-server-policy:17:1, type: POLICY_CHANGE]
11:57:35.334
elastic_agent
[elastic_agent][error] Cannot checkin in with fleet-server, retrying
11:47:32.828
elastic_agent
[elastic_agent][error] Checkin request to fleet-server succeeded after 273 failures
Showing entries until Jun 9, 11:47:32
```
Hope this helps.
Regards,
---
### Author:  [@MichelLaterman](https://discuss.elastic.co/u/MichelLaterman)
#### Post date: [June 9, 2023, 5:35pm UTC](https://discuss.elastic.co/t/fail-to-checkin-to-fleet-server/334210/16 "2023-06-09T17:35:27Z")
Thanks for the elastic-agent logs.
We can see from your earlier post that fleet-server is running (in IPv4) on `127.0.0.1:8221`, and for some reason on IPv6 on `:::8220`
Some of these messages are very strange to me, we can see it attempt to connect to fleet-server on the local host on both IPv4 and IPv6:
```auto
dial tcp 127.0.0.1:8221: connect: connection refused
dial tcp [::1]:8221: connect: connection refused
```
I'm not sure why the IPv4 connection is being refused - the only thing I've seen that's similar is when port mapping for a container/vm is active,
for example:
```auto
$ lsof | grep 8220
VBoxHeadl 9632 laterman 12u IPv4 0x63e83566b40cb98d 0t0 TCP *:8220 (LISTEN)
fleet-ser 10291 laterman 14u IPv6 0x63e8355d1ea6c525 0t0 TCP *:8220 (LISTEN)
```
Can you confirm if there are any containers or vms mapping ports?
Can you also provide the logs from when fleet-server has started? There are some messages that contain the listening address.
---
### Author:  [@ethical20](https://discuss.elastic.co/u/ethical20)
#### Post date: [June 12, 2023, 12:33pm UTC](https://discuss.elastic.co/t/fail-to-checkin-to-fleet-server/334210/17 "2023-06-12T12:33:16Z")
Thanks @MichelLaterman for the follow up.
What I've done now is that I have got a new server, installed fleet server on it and agents are now connecting normally to the new server.
But to be honest I couldn't identify the issue behind such thing.
Here are the results from the new working server:
```auto
netstat -tulpn
Active Internet connections (only servers)
Proto Recv-Q Send-Q Local Address Foreign Address State PID/Program name
tcp 0 0 127.0.0.1:8221 0.0.0.0:* LISTEN 424069/fleet-server
tcp 0 0 127.0.0.1:6789 0.0.0.0:* LISTEN 423798/elastic-agen
tcp 0 0 127.0.0.1:6791 0.0.0.0:* LISTEN 423798/elastic-agen
tcp 0 0 0.0.0.0:5355 0.0.0.0:* LISTEN 251718/systemd-reso
tcp 0 0 127.0.0.53:53 0.0.0.0:* LISTEN 251718/systemd-reso
tcp 0 0 0.0.0.0:22 0.0.0.0:* LISTEN 250/sshd: /usr/sbin
tcp 0 0 127.0.0.1:25 0.0.0.0:* LISTEN 521/exim4
tcp6 0 0 :::8220 :::* LISTEN 424069/fleet-server
tcp6 0 0 :::5355 :::* LISTEN 251718/systemd-reso
tcp6 0 0 :::22 :::* LISTEN 250/sshd: /usr/sbin
tcp6 0 0 ::1:25 :::* LISTEN 521/exim4
udp 0 0 127.0.0.53:53 0.0.0.0:* 251718/systemd-reso
udp 0 0 0.0.0.0:5355 0.0.0.0:* 251718/systemd-reso
udp6 0 0 :::5355 :::* 251718/systemd-reso
root@newsrv:~# netstat -pln | grep 8220
tcp6 0 0 :::8220 :::* LISTEN 424069/fleet-server
```
Curl from Agent to new server
```auto
url https://NN.NN.NN.NN:8220/api/status
curl: (60) SSL certificate problem: unable to get local issuer certificate
```
```auto
elastic-agent status
State: HEALTHY
Message: Running
Fleet State: HEALTHY
Fleet Message: Connected
Components:
* log (HEALTHY)
Healthy: communicating with pid '424058'
* system/metrics (HEALTHY)
Healthy: communicating with pid '424063'
* fleet-server (HEALTHY)
Healthy: communicating with pid '424069'
* nginx/metrics (HEALTHY)
Healthy: communicating with pid '424076'
* filestream (HEALTHY)
Healthy: communicating with pid '424082'
* beat/metrics (HEALTHY)
Healthy: communicating with pid '424088'
* http/metrics (HEALTHY)
Healthy: communicating with pid '424094'
```
Here are the results from the _ **OLD** _ fleet server:
```auto
netstat -tulpn
Active Internet connections (only servers)
Proto Recv-Q Send-Q Local Address Foreign Address State PID/Program name
tcp 0 0 127.0.0.1:631 0.0.0.0:* LISTEN 31924/cupsd
tcp 0 0 127.0.0.1:8221 0.0.0.0:* LISTEN 21167/fleet-server
tcp 0 0 127.0.0.1:6789 0.0.0.0:* LISTEN 414/elastic-agent
tcp 0 0 127.0.0.1:6791 0.0.0.0:* LISTEN 414/elastic-agent
tcp 0 0 0.0.0.0:22 0.0.0.0:* LISTEN 482/sshd
tcp6 0 0 ::1:631 :::* LISTEN 31924/cupsd
tcp6 0 0 :::8220 :::* LISTEN 21167/fleet-server
tcp6 0 0 :::22 :::* LISTEN 482/sshd
udp 0 0 0.0.0.0:58943 0.0.0.0:* 422/avahi-daemon: r
udp 0 0 0.0.0.0:68 0.0.0.0:* 489/dhclient
udp 0 0 0.0.0.0:631 0.0.0.0:* 31925/cups-browsed
udp 0 0 0.0.0.0:5353 0.0.0.0:* 422/avahi-daemon: r
udp6 0 0 :::51714 :::* 422/avahi-daemon: r
udp6 0 0 :::5353 :::* 422/avahi-daemon: r
root@oldsrv:~# netstat -pln | grep 8220
tcp6 0 0 :::8220 :::* LISTEN 21167/fleet-server
```
Curl from Agent to old server
```auto
curl https://XX.XX.XX.XX:8220/api/status
curl: (28) Failed to connect to XX.XX.XX.XX port 8220: Connection timed out
```
```auto
elastic-agent status
State: HEALTHY
Message: Running
Fleet State: HEALTHY
Fleet Message: Connected
Components:
* fleet-server (HEALTHY)
Healthy: communicating with pid '21167'
* filestream (HEALTHY)
Healthy: communicating with pid '21172'
* beat/metrics (HEALTHY)
Healthy: communicating with pid '21177'
* http/metrics (HEALTHY)
Healthy: communicating with pid '21179'
```
Actually I don't know why the curl on old server is timing out.
As this issue is more server / network related (non general issue), I will be glad to thank all who helped especially @MichelLaterman and close this ticket.
Regards,
---
### Author:  [@system](https://discuss.elastic.co/u/system)
#### Post date: [July 10, 2023, 12:33pm UTC](https://discuss.elastic.co/t/fail-to-checkin-to-fleet-server/334210/18 "2023-07-10T12:33:32Z")
This topic was automatically closed 28 days after the last reply. New replies are no longer allowed.