# Finding the script/query behind a table
**URL:** https://discuss.elastic.co/t/finding-the-script-query-behind-a-table/80032
**Category:** Kibana
**Created:** [March 26, 2017, 8:27am UTC](https://discuss.elastic.co/t/finding-the-script-query-behind-a-table/80032 "2017-03-26T08:27:16Z")
**Posts on this page:** 8
**Page:** 1
### Author:  [@tomer](https://discuss.elastic.co/u/tomer)
#### Post date: [March 26, 2017, 8:27am UTC](https://discuss.elastic.co/t/finding-the-script-query-behind-a-table/80032/1 "2017-03-26T08:27:16Z")
How can I found the script/query behind a table (Kibana 5).
For an example in this table:

I want to see the query on how to get the field of hits.total (that is equal to 96)
---
### Author:  [@weltenwort](https://discuss.elastic.co/u/weltenwort)
#### Post date: [March 27, 2017, 5:05am UTC](https://discuss.elastic.co/t/finding-the-script-query-behind-a-table/80032/2 "2017-03-27T05:05:19Z")
Hi @tomer,
on every visualization there is a small arrow at the bottom:

Upon clicking that arrow, Kibana will show various textual information about the visualization including the query used to fetch the displayed data:

---
### Author:  [@tomer](https://discuss.elastic.co/u/tomer)
#### Post date: [March 27, 2017, 6:23am UTC](https://discuss.elastic.co/t/finding-the-script-query-behind-a-table/80032/3 "2017-03-27T06:23:47Z")
Thanks this will save me a lot of time!!
---
### Author:  [@AlexM](https://discuss.elastic.co/u/AlexM)
#### Post date: [March 27, 2017, 8:33am UTC](https://discuss.elastic.co/t/finding-the-script-query-behind-a-table/80032/4 "2017-03-27T08:33:13Z")
Hello @weltenwort,
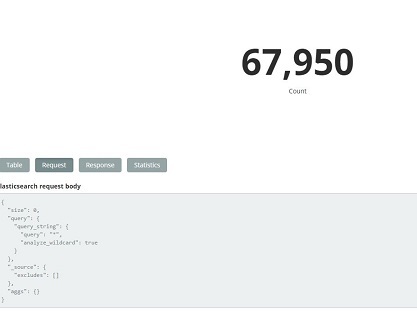
How to enable this option "Debug" in any type of visualization? there is no this feature in my Kibana (Version: 5.2.2) ☹

---
### Author:  [@weltenwort](https://discuss.elastic.co/u/weltenwort)
#### Post date: [March 27, 2017, 8:42am UTC](https://discuss.elastic.co/t/finding-the-script-query-behind-a-table/80032/5 "2017-03-27T08:42:40Z")
I was taking the screenshot while running Kibana in development mode (with `--dev`). The "Debug" panel displays some internals about the visualization useful for debugging during development.
---
### Author:  [@AlexM](https://discuss.elastic.co/u/AlexM)
#### Post date: [March 27, 2017, 11:47am UTC](https://discuss.elastic.co/t/finding-the-script-query-behind-a-table/80032/6 "2017-03-27T11:47:29Z")
Thanks for reply,
So can you change the requst in the debug window?
For example I want to change colors and other atributes, but in Request there are no thise features.
Can you please describe more about Debug, or doc. Thanks you very much.
---
### Author:  [@weltenwort](https://discuss.elastic.co/u/weltenwort)
#### Post date: [March 27, 2017, 12:35pm UTC](https://discuss.elastic.co/t/finding-the-script-query-behind-a-table/80032/7 "2017-03-27T12:35:53Z")
The "Debug" window just displays some internal values of the visualization configuration for debugging during developent. In order to change the color associated with a bucket, just click a legend entry on the right to open a color picker. The configurable attributes of each visualization type are described in [the documentation](https://www.elastic.co/guide/en/kibana/current/createvis.html).
---
### Author:  [@system](https://discuss.elastic.co/u/system)
#### Post date: [April 24, 2017, 12:36pm UTC](https://discuss.elastic.co/t/finding-the-script-query-behind-a-table/80032/8 "2017-04-24T12:36:12Z")
This topic was automatically closed 28 days after the last reply. New replies are no longer allowed.