# Fitlers in buckets are not working in kibana pie chart
**URL:** https://discuss.elastic.co/t/fitlers-in-buckets-are-not-working-in-kibana-pie-chart/205521
**Category:** Kibana
**Created:** [October 28, 2019, 5:04pm UTC](https://discuss.elastic.co/t/fitlers-in-buckets-are-not-working-in-kibana-pie-chart/205521 "2019-10-28T17:04:04Z")
**Posts on this page:** 12
**Page:** 1
### Author:  [@PraveenKT](https://discuss.elastic.co/u/PraveenKT)
#### Post date: [October 28, 2019, 5:04pm UTC](https://discuss.elastic.co/t/fitlers-in-buckets-are-not-working-in-kibana-pie-chart/205521/1 "2019-10-28T17:04:04Z")
I am trying to add multiple Monitors and their up and down status in in single Pie visualization. Each monitor as a donut and up and down status are as slices.
I used below:
Metric: Count
Bucket 1: filter
monitor.name:xxxx and monitor.status:up
monitor.name:xxxx and mointor.status:down
Bucket 2: filter
monitor.name:yyyy and monitor.status:up
monitor.name:yyyy and mointor.status:down
Bucket 3: filter
monitor.name:zzzz and monitor.status:up
monitor.name:zzzz and mointor.status:down
I am expecting 3 donuts but i am seeing only 1.
May I know what i am missing to get 3 donuts.

---
### Author:  [@flash1293](https://discuss.elastic.co/u/flash1293)
#### Post date: [October 28, 2019, 7:08pm UTC](https://discuss.elastic.co/t/fitlers-in-buckets-are-not-working-in-kibana-pie-chart/205521/2 "2019-10-28T19:08:08Z")
Hi @PraveenKT,
you can achieve this by doing two separate "filters" aggregations - one to split the slices and one to split the charts themselves. The screenshot is cut of in this place but it looks like you have two separate bucket aggregations both for slice splitting - this would create a hierarchical pie chart. If you add a bucket aggregation you can select whether you want to split the chart or the slices.
The chart split aggregation should have the filters "monitor.name:xxxx", "monitor.name:yyyy" and "monitor.name:zzzz", the slice split aggregation should have the filters "monitor.status:up" and "monitor.status:down".
Let me know whether that helps.
---
### Author:  [@PraveenKT](https://discuss.elastic.co/u/PraveenKT)
#### Post date: [October 29, 2019, 7:36am UTC](https://discuss.elastic.co/t/fitlers-in-buckets-are-not-working-in-kibana-pie-chart/205521/3 "2019-10-29T07:36:32Z")
Hello Joe Reuter,
Thank you for the reply. I adding filters "monitor.name:xx" to Split chart and monitor.status:up and down to split slice. I am getting 3 separate Donuts(colouman splitted based on monitor.name).

But I am expecting like below, 3 donuts one on above with up and down status.

---
### Author:  [@flash1293](https://discuss.elastic.co/u/flash1293)
#### Post date: [October 29, 2019, 8:59am UTC](https://discuss.elastic.co/t/fitlers-in-buckets-are-not-working-in-kibana-pie-chart/205521/4 "2019-10-29T08:59:30Z")
Ah sorry, then I misunderstood you. In that case two "split slices" bucket aggregations are the right thing to do, with the filters in the original answer.
So first "split slices" has "monitor.name:xxxx", "monitor.name:yyyy" and "monitor.name:zzzz" and second split slices has "monitor.status:up" and "monitor.status:down". If you define multiple bucket aggregations they are "nested" into each other, so with this filters configuration you will get the up and down status for each monitor.
---
### Author:  [@PraveenKT](https://discuss.elastic.co/u/PraveenKT)
#### Post date: [October 31, 2019, 7:58pm UTC](https://discuss.elastic.co/t/fitlers-in-buckets-are-not-working-in-kibana-pie-chart/205521/5 "2019-10-31T19:58:43Z")
Hello Joe Reuter,
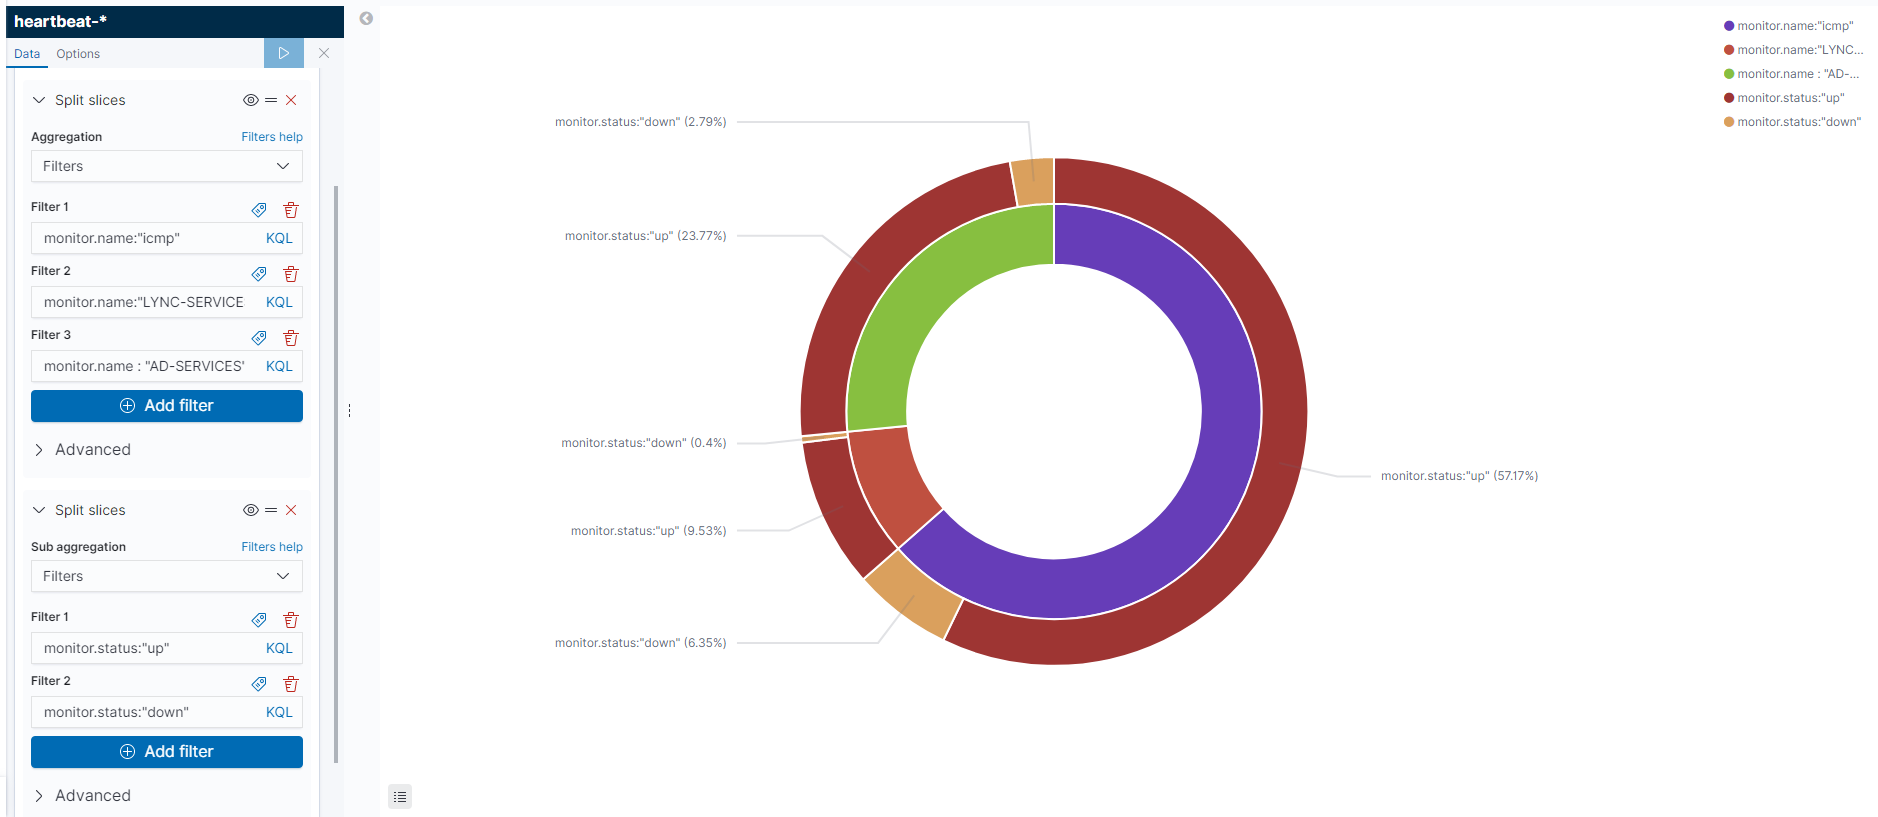
I tried as you told but no luck. PFA screenshot
---
### Author:  [@flash1293](https://discuss.elastic.co/u/flash1293)
#### Post date: [November 1, 2019, 9:29am UTC](https://discuss.elastic.co/t/fitlers-in-buckets-are-not-working-in-kibana-pie-chart/205521/6 "2019-11-01T09:29:05Z")
What are you expecting exactly? The chart from your screenshot looks the same for me as the one from the Metricbeat dashboard above. For nice labels instead of the queries you can click on the little tag icon next to the filter input and specify one.
---
### Author:  [@PraveenKT](https://discuss.elastic.co/u/PraveenKT)
#### Post date: [November 8, 2019, 9:33am UTC](https://discuss.elastic.co/t/fitlers-in-buckets-are-not-working-in-kibana-pie-chart/205521/7 "2019-11-08T09:33:02Z")
Hello Joe,
I am expecting donut for every Heartbeat monitor and one on another not side by side. in above screenshot i am seeing all the heartbeat monitors in single donut.
---
### Author:  [@flash1293](https://discuss.elastic.co/u/flash1293)
#### Post date: [November 8, 2019, 10:47am UTC](https://discuss.elastic.co/t/fitlers-in-buckets-are-not-working-in-kibana-pie-chart/205521/8 "2019-11-08T10:47:35Z")
But isn't that exactly the result you had in the third post in this thread? You have three donuts there, one for each monitor with the up and down status as slices. If you want to further split the slices for each donut, you can keep adding "Split slices" filters aggregations.
What exactly do you mean by "and one on another"?
---
### Author:  [@PraveenKT](https://discuss.elastic.co/u/PraveenKT)
#### Post date: [November 8, 2019, 1:47pm UTC](https://discuss.elastic.co/t/fitlers-in-buckets-are-not-working-in-kibana-pie-chart/205521/9 "2019-11-08T13:47:50Z")
Hi,
As shown in below diagram each donut represent a Heart monitor. and each donut further divided into UP & DOWN count.

---
### Author:  [@flash1293](https://discuss.elastic.co/u/flash1293)
#### Post date: [November 9, 2019, 2:37pm UTC](https://discuss.elastic.co/t/fitlers-in-buckets-are-not-working-in-kibana-pie-chart/205521/10 "2019-11-09T14:37:08Z")
I see, that's not possible with the pie visualization. The "rings" always indicate a hierarchy whereas in your case each ring would be unrelated to the ring before.
You could try to build such a visualization with [Vega](https://www.elastic.co/guide/en/kibana/current/vega-graph.html) or [Canvas](https://www.elastic.co/guide/en/kibana/current/canvas.html) where you have more freedom in how the visualizaton looks. These alternatives have downsides though - Vega is basically a separate programming language and not easy to learn and Canvas visualizations are currently not embeddable in dashboards.
However as this way of visualizing data is pretty uncommon, for your use case I would suggest using a two-ring donut in which the rings form a hierarchy (just like in the metricbeat example you posted and in your post following that) or even a bar chart which makes it easier to grasp the information you want to show.
---
### Author:  [@PraveenKT](https://discuss.elastic.co/u/PraveenKT)
#### Post date: [November 10, 2019, 1:30am UTC](https://discuss.elastic.co/t/fitlers-in-buckets-are-not-working-in-kibana-pie-chart/205521/11 "2019-11-10T01:30:26Z")
Got it thank you for your support.
---
### Author:  [@system](https://discuss.elastic.co/u/system)
#### Post date: [December 8, 2019, 1:30am UTC](https://discuss.elastic.co/t/fitlers-in-buckets-are-not-working-in-kibana-pie-chart/205521/12 "2019-12-08T01:30:29Z")
This topic was automatically closed 28 days after the last reply. New replies are no longer allowed.