# Frequency distribution Graph in elasticsearch
**URL:** https://discuss.elastic.co/t/frequency-distribution-graph-in-elasticsearch/94142
**Category:** Elasticsearch
**Created:** [July 21, 2017, 5:45pm UTC](https://discuss.elastic.co/t/frequency-distribution-graph-in-elasticsearch/94142 "2017-07-21T17:45:50Z")
**Posts on this page:** 4
**Page:** 1
### Author:  [@mussa572](https://discuss.elastic.co/u/mussa572)
#### Post date: [July 21, 2017, 5:45pm UTC](https://discuss.elastic.co/t/frequency-distribution-graph-in-elasticsearch/94142/1 "2017-07-21T17:45:51Z")
Dear All,
We have index that holds the number of orders sent to use by users . Each order holds the Latency value which confirms how long system took to process this order . The latency values Can range from (0.01 ms to 200 ms (ms is in millisecond ) .
We are interested plotting the frequency distribution graph in Kibana using ELK which shows the number of orders in different latency interval for example latency range can be (0ms to 5 ms , 5ms- 10ms , 10ms-15ms up to 195ms to 200ms) .
I am trying to achieve this using Histogram aggregation but each time I run the aggregation it breaks Elasticsearch and all shard goes to Red. Only solution is then to reboot the eLK server .
Just wondering if there is any way I can achieve the above request .
Thanks in Advance .
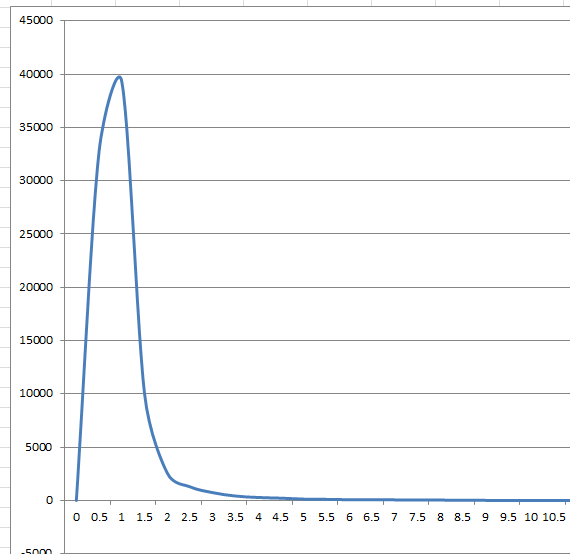
Regards
ali
---
### Author:  [@mussa572](https://discuss.elastic.co/u/mussa572)
#### Post date: [July 22, 2017, 10:40pm UTC](https://discuss.elastic.co/t/frequency-distribution-graph-in-elasticsearch/94142/2 "2017-07-22T22:40:33Z")
Hi All
Any update on above issue . Below is the histogram aggregation i am running from Kibana . Which not only kill the Kibana but also kills the Elasticsearch .
Is there a limitation where elasticsearch can only handle certain number of values in histogram aggragtion .


---
### Author:  [@warkolm](https://discuss.elastic.co/u/warkolm)
#### Post date: [July 23, 2017, 11:20pm UTC](https://discuss.elastic.co/t/frequency-distribution-graph-in-elasticsearch/94142/3 "2017-07-23T23:20:01Z")
> [@mussa572](#):
>
> I am trying to achieve this using Histogram aggregation but each time I run the aggregation it breaks Elasticsearch and all shard goes to Red. Only solution is then to reboot the eLK server .
Why?
What's in the logs?
---
### Author:  [@system](https://discuss.elastic.co/u/system)
#### Post date: [August 20, 2017, 11:20pm UTC](https://discuss.elastic.co/t/frequency-distribution-graph-in-elasticsearch/94142/4 "2017-08-20T23:20:03Z")
This topic was automatically closed 28 days after the last reply. New replies are no longer allowed.