# Generate report in Kibana results in 404
**URL:** https://discuss.elastic.co/t/generate-report-in-kibana-results-in-404/269050
**Category:** Kibana
**Created:** [April 1, 2021, 3:42pm UTC](https://discuss.elastic.co/t/generate-report-in-kibana-results-in-404/269050 "2021-04-01T15:42:03Z")
**Posts on this page:** 10
**Page:** 1
### Author:  [@eeijlar](https://discuss.elastic.co/u/eeijlar)
#### Post date: [April 1, 2021, 3:42pm UTC](https://discuss.elastic.co/t/generate-report-in-kibana-results-in-404/269050/1 "2021-04-01T15:42:03Z")
If I generate a pdf report from Kibana web UI, using Share \> PDF Reports \> Generate PDF.
Then I got to : Stack Management \> Reporting \> Download report
The resulting report just has:

ELK Stack version 7.11.2
The same happens if I try and generate a png report.
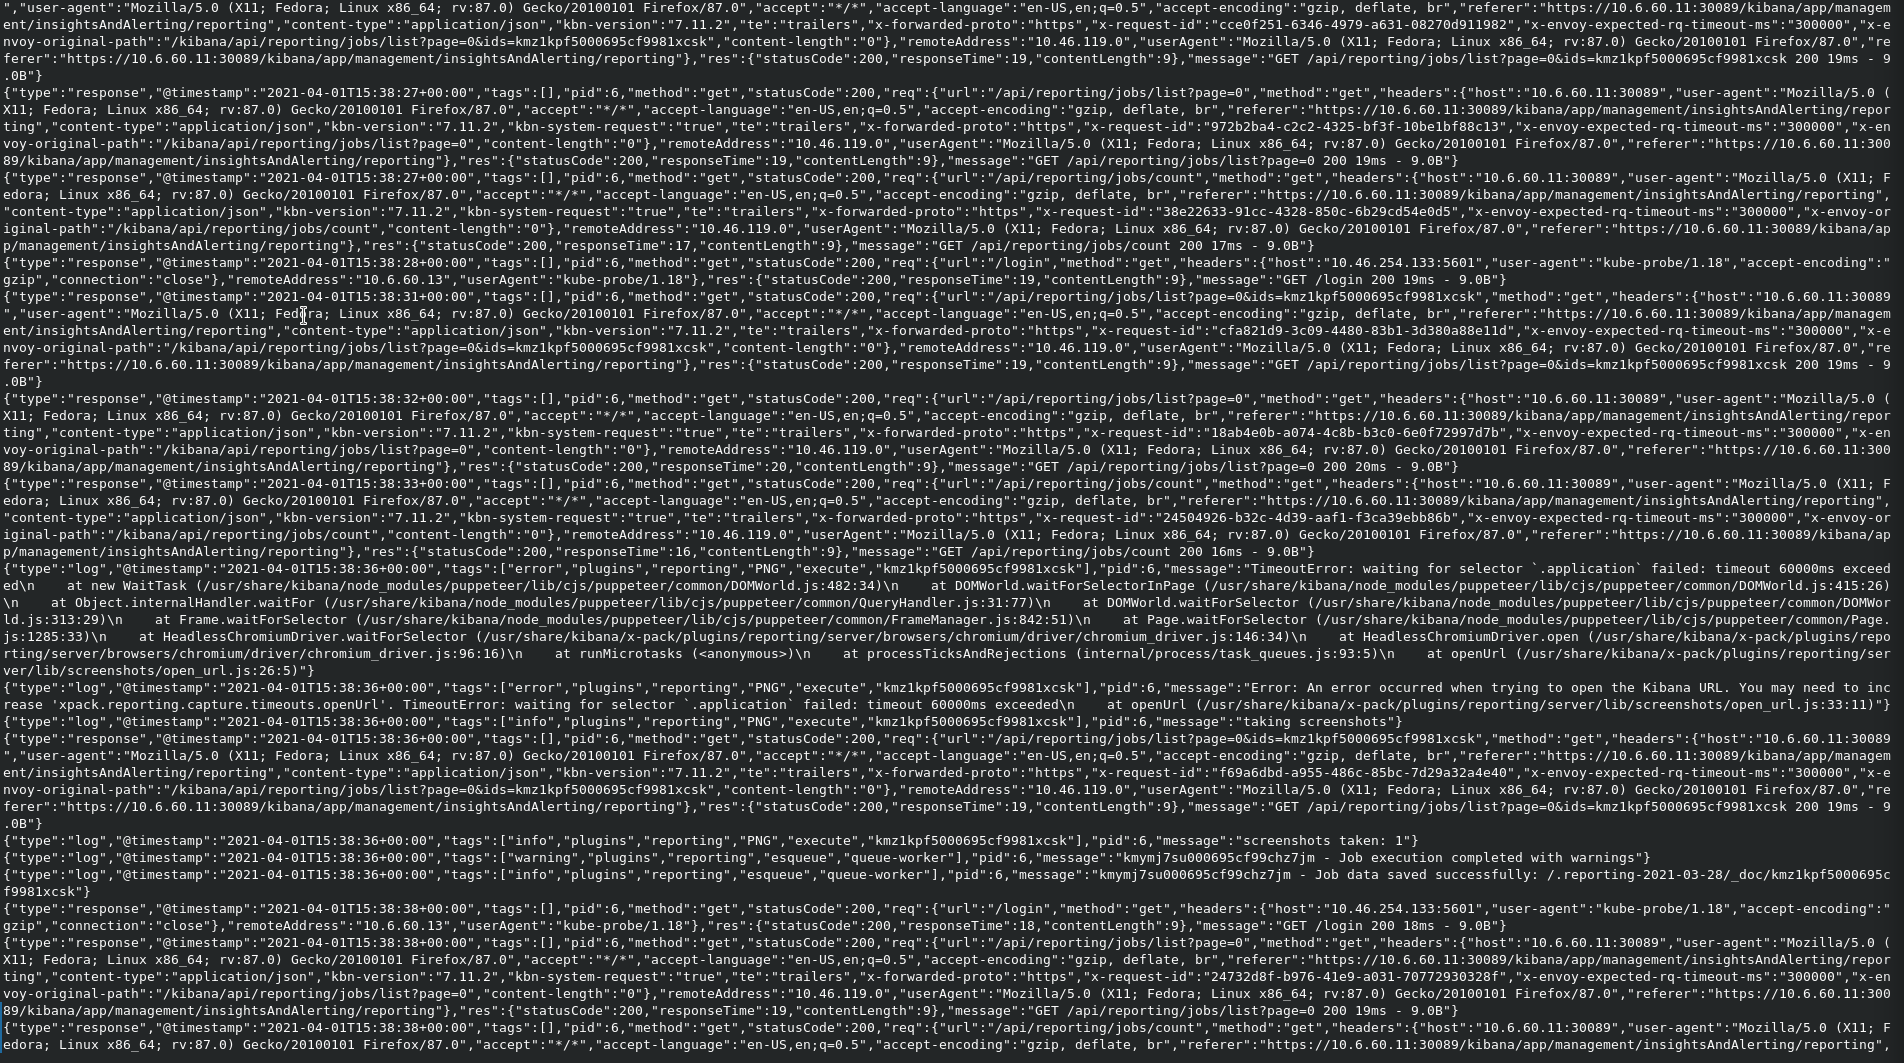
Extract from kibana logs:
---
### Author:  [@Marco\_Liberati](https://discuss.elastic.co/u/Marco_Liberati)
#### Post date: [April 2, 2021, 9:39am UTC](https://discuss.elastic.co/t/generate-report-in-kibana-results-in-404/269050/2 "2021-04-02T09:39:55Z")
Hi @eeiijlar
from the log screenshot it seems that the server goes in timeout when generating the report.
You may either increase the `xpack.reporting.queue.timeout`.
At this page you can find all the specific parameters with timeout defaults for `reporting`: [Add Kibana user settings | Elasticsearch Service Documentation | Elastic](https://www.elastic.co/guide/en/cloud/current/ec-manage-kibana-settings.html)
Another option would be to increase the amount of RAM dedicated to the Kibana server. This also has worked for other users who are dealing with big PDF reports.
---
### Author:  [@eeijlar](https://discuss.elastic.co/u/eeijlar)
#### Post date: [April 6, 2021, 5:08pm UTC](https://discuss.elastic.co/t/generate-report-in-kibana-results-in-404/269050/3 "2021-04-06T17:08:20Z")
Hi @Marco_Liberati
I doubled the resources availabe to kibana in kubernetes:
```
containers:
- name: kibana
resources:
requests:
cpu: "2"
memory: 4G
limits:
cpu: "2"
memory: 8G
```
It didn't make any difference. I also tried a png, which has 120 second timeout as opposed to 60 second for pdf. It produced the same error. Now though I see the following in the logs:

---
### Author:  [@Marco\_Liberati](https://discuss.elastic.co/u/Marco_Liberati)
#### Post date: [April 7, 2021, 8:35am UTC](https://discuss.elastic.co/t/generate-report-in-kibana-results-in-404/269050/4 "2021-04-07T08:35:16Z")
That SSL error seems to be relative to the certificate not being liked by the engine used to create the report PDF/PNG (same as a browser). You can find more about it in this [issue](https://github.com/elastic/kibana/issues/35004).
May I ask some information about your kubernetes configuration?
For example do you have a `SERVER_BASEPATH` value? How is set?
That may help to debug a configuration issue.
---
### Author:  [@eeijlar](https://discuss.elastic.co/u/eeijlar)
#### Post date: [April 7, 2021, 8:39am UTC](https://discuss.elastic.co/t/generate-report-in-kibana-results-in-404/269050/5 "2021-04-07T08:39:48Z")
Hi @Marco_Liberati
Where can I get the value of `SERVER_BASEPATH`? I have checked the environment on the kibana pod, but I don't see it set there. I am assuming it is an environment variable.
John
---
### Author:  [@Marco\_Liberati](https://discuss.elastic.co/u/Marco_Liberati)
#### Post date: [April 7, 2021, 8:57am UTC](https://discuss.elastic.co/t/generate-report-in-kibana-results-in-404/269050/6 "2021-04-07T08:57:35Z")
Yes, that is an environment variable.
Is it possible to see some kubernetes config? That may help.
---
### Author:  [@eeijlar](https://discuss.elastic.co/u/eeijlar)
#### Post date: [April 7, 2021, 9:28am UTC](https://discuss.elastic.co/t/generate-report-in-kibana-results-in-404/269050/7 "2021-04-07T09:28:32Z")
Which config specifically?
This is what our pods look like:
```auto
NAMESPACE NAME READY STATUS RESTARTS AGE
cert-manager cert-manager-545b78f84-27fl9 1/1 Running 1 12d
cert-manager cert-manager-cainjector-cfc495bc5-h8x4k 1/1 Running 18 12d
cert-manager cert-manager-webhook-56fb559c6b-zcczm 1/1 Running 0 12d
consul consul-consul-cwzxf 1/1 Running 1 13d
consul consul-consul-p4qn2 1/1 Running 1 13d
consul consul-consul-server-0 1/1 Running 39 13d
consul consul-consul-server-1 1/1 Running 42 13d
consul consul-consul-server-2 1/1 Running 2 25h
consul consul-consul-tq5lp 1/1 Running 1 13d
fleet-system fleet-agent-86bd4555b5-p4gx7 1/1 Running 2 13d
monitoring elastic-operator-0 1/1 Running 1 11m
monitoring gateway-6596c5fbfd-jlqzd 1/1 Running 2 11m
monitoring gateway-proxy-79554b4856-x8k78 1/1 Running 0 11m
monitoring gloo-7775df6cc9-d5gkf 1/1 Running 2 11m
monitoring monitoring-elasticsearch-es-default-0 1/1 Running 0 10m
monitoring monitoring-fb-beat-filebeat-6jh42 1/1 Running 0 10m
monitoring monitoring-fb-beat-filebeat-dngk7 1/1 Running 0 10m
monitoring monitoring-fb-beat-filebeat-zsqrs 1/1 Running 0 10m
monitoring monitoring-kibana-kb-6b47cffc8f-b492b 1/1 Running 0 10m
monitoring monitoring-kube-state-metrics-6748dc48f6-r86xr 1/1 Running 0 11m
monitoring monitoring-logstash-0 1/1 Running 0 11m
monitoring monitoring-mb-beat-metricbeat-2f6v4 1/1 Running 1 9m43s
monitoring monitoring-mb-beat-metricbeat-fjcr4 1/1 Running 1 9m43s
monitoring monitoring-mb-beat-metricbeat-p2p69 1/1 Running 1 9m43s
monitoring monitoring-metrics-beat-metricbeat-5d695d78b5-6lqqv 1/1 Running 1 9m43s
```
One thing which may be non standard is that each of our services have the name of the service appended onto the url, so the Kibana url will be: `https://:/kibana`, elastic will be: `https://:/elasticsearch` etc
---
### Author:  [@eeijlar](https://discuss.elastic.co/u/eeijlar)
#### Post date: [April 13, 2021, 1:03pm UTC](https://discuss.elastic.co/t/generate-report-in-kibana-results-in-404/269050/8 "2021-04-13T13:03:45Z")
Any ideas @Marco_Liberati ? I will have to open a support ticket if not.
We also see this error:
```auto
"type":"log","@timestamp":"2021-04-13T12:50:48+00:00","tags":["error","plugins","reporting","printable_pdf","execute-job","kng0v4hw00060534945dwt94","kng0v4hw00060534945dwt94"],"pid":6,"message":"TimeoutError: waiting for selector `.application` failed: timeout 60000ms exceeded\n at new WaitTask (/usr/share/kibana/node_modules/puppeteer/lib/cjs/puppeteer/common/DOMWorld.js:482:34)\n at DOMWorld.waitForSelectorInPage (/usr/share/kibana/node_modules/puppeteer/lib/cjs/puppeteer/common/DOMWorld.js:415:26)\n at Object.internalHandler.waitFor (/usr/share/kibana/node_modules/puppeteer/lib/cjs/puppeteer/common/QueryHandler.js:31:77)\n at DOMWorld.waitForSelector (/usr/share/kibana/node_modules/puppeteer/lib/cjs/puppeteer/common/DOMWorld.js:313:29)\n at Frame.waitForSelector (/usr/share/kibana/node_modules/puppeteer/lib/cjs/puppeteer/common/FrameManager.js:842:51)\n at Page.waitForSelector (/usr/share/kibana/node_modules/puppeteer/lib/cjs/puppeteer/common/Page.js:1285:33)\n at HeadlessChromiumDriver.waitForSelector (/usr/share/kibana/x-pack/plugins/reporting/server/browsers/chromium/driver/chromium_driver.js:146:34)\n at HeadlessChromiumDriver.open (/usr/share/kibana/x-pack/plugins/reporting/server/browsers/chromium/driver/chromium_driver.js:96:16)\n at processTicksAndRejections (internal/process/task_queues.js:93:5)\n at openUrl (/usr/share/kibana/x-pack/plugins/reporting/server/lib/screenshots/open_url.js:26:5)"}
{"type":"log","@timestamp":"2021-04-13T12:50:48+00:00","tags":["error","plugins","reporting","printable_pdf","execute-job","kng0v4hw00060534945dwt94","kng0v4hw00060534945dwt94"],"pid":6,"message":"Error: An error occurred when trying to open the Kibana URL. You may need to increase 'xpack.reporting.capture.timeouts.openUrl'. TimeoutError: waiting for selector `.application` failed: timeout 60000ms exceeded\n at openUrl (/usr/share/kibana/x-pack/plugins/reporting/server/lib/screenshots/open_url.js:33:11)"}
```
---
### Author:  [@Marco\_Liberati](https://discuss.elastic.co/u/Marco_Liberati)
#### Post date: [April 13, 2021, 2:00pm UTC](https://discuss.elastic.co/t/generate-report-in-kibana-results-in-404/269050/9 "2021-04-13T14:00:22Z")
Hi @eeijlar ,
I tried to look into the issue more, but I think opening a support ticket would provide better help on this topic.
---
### Author:  [@system](https://discuss.elastic.co/u/system)
#### Post date: [May 11, 2021, 2:00pm UTC](https://discuss.elastic.co/t/generate-report-in-kibana-results-in-404/269050/10 "2021-05-11T14:00:32Z")
This topic was automatically closed 28 days after the last reply. New replies are no longer allowed.