# Global ordinals performance and size on-heap
**URL:** https://discuss.elastic.co/t/global-ordinals-performance-and-size-on-heap/158320
**Category:** Elasticsearch
**Created:** [November 27, 2018, 10:48am UTC](https://discuss.elastic.co/t/global-ordinals-performance-and-size-on-heap/158320 "2018-11-27T10:48:40Z")
**Posts on this page:** 10
**Page:** 1
### Author:  [@Itamar\_Syn\_Hershko](https://discuss.elastic.co/u/Itamar_Syn_Hershko)
#### Post date: [November 27, 2018, 10:48am UTC](https://discuss.elastic.co/t/global-ordinals-performance-and-size-on-heap/158320/1 "2018-11-27T10:48:40Z")
Hi Elastic folks,
We are seeing significant performance hit stemming from the usage of global ordinals (CPU, heap, GC). All background on our specific situation is below, points in question are:
1. Loading of global ordinals seem to sometimes run forever, with no circuit breakers triggered (see numbers below). Is that intentional?
2. The docs state "The loading time of global ordinals depends on the number of terms in a field, but in general it is low, since it source field data has already been loaded. The memory overhead of global ordinals is a small because it is very efficiently compressed." (see [https://www.elastic.co/guide/en/elasticsearch/reference/current/eager-global-ordinals.html](https://www.elastic.co/guide/en/elasticsearch/reference/current/eager-global-ordinals.html)). This doesn't seem to be the case in our use-case - loading times are high and significant memory is consumed. Are the docs wrong, or is this a corner case worth checking in the ES codebase?
3. Seems like fields defined with IP datatype in the mapping take even longer to load (10-20% slower) - is there a reason for that? should we use multi-field (IP datatype for search, keyword for aggs)? Can we avoid multi-field?
4. Other aggregations, most notably the date histogram aggregation, run perfectly well and very fast also on fields with very high cardinality. Is there a way to use the same technique for terms aggregation as well? in our case approximate counts will be ok too.
5. The docs for the `map` execution hint state ([https://www.elastic.co/guide/en/elasticsearch/reference/current/search-aggregations-bucket-terms-aggregation.html](https://www.elastic.co/guide/en/elasticsearch/reference/current/search-aggregations-bucket-terms-aggregation.html)): "Please note that Elasticsearch will ignore this execution hint if it is not applicable and that there is no backward compatibility guarantee on these hints." . Since the map execution hint is (currently) required for such queries to run, can the docs state those "not applicable" scenarios explicitly?
6. Can global ordinals be monitored somehow? I couldn't find any obvious metric that would return the amount of memory it consumes, and in our case where significant amount of heap space is consumed, we just attribute it to global ordinals, true or not.
_ **Background:** _
We have an index with a `source_ip` field. This field has a very high cardinality (about 90% of documents count). Tested with several versions of 6.x, latest 6.4.3.
When executing a terms aggregation on this field (mapped as keyword), initial query takes a lot of time to run also on a decent cluster with decent nodes, for a large corpus. A terms agg query on a 400m docs corpus ran for an hour before we killed it; on 70m docs it returned in 15-20 minutes. Subsequent queries ran fast, hence the attribution of latency to loading of global ordinals. Also, using the map execution hint helps.
This is how the search task looks like (got up to 55 minutes, then we killed the search task):
```auto
GET _cat/tasks?v
action task_id parent_task_id type start_time timestamp running_time ip node
indices:data/read/search IJJVLCApT_KsA283KwS_oA:481102 - transport 1542704145263 08:55:45 4.7m 10.0.0.11 ip-10-0-0-11
indices:data/read/search[phase/query] RoXZonzjQs-IaFdaIRORww:9599 IJJVLCApT_KsA283KwS_oA:481102 netty 1542704145263 08:55:45 4.7m 10.0.0.33 ip-10-0-0-33
...
...
```
We observe about 4-5GB of unexplained heap usage - there is no evident monitoring for the space global ordinals occupy and as such we attributes this amount of memory to them.
The same happens when the field is defined as IP datatype, but seems to run even longer (for the 70m case, where it completes). Cardinality aggregation returns exactly the same cardinality value for both keyword and ip variants (on a small dataset with `precision_threshold` set to 40k), so doc\_values for the IP field seems to be persisted correctly. Also, `docvalue_fields` returns the correct expected values.
Machines are i3 instances on AWS, so CPU, memory and especially disk IO are not a concern.
Looking forward for helpful advice,
Itamar
---
### Author:  [@jimczi](https://discuss.elastic.co/u/jimczi)
#### Post date: [November 27, 2018, 11:34am UTC](https://discuss.elastic.co/t/global-ordinals-performance-and-size-on-heap/158320/2 "2018-11-27T11:34:45Z")
> Loading of global ordinals seem to sometimes run forever, with no circuit breakers triggered (see numbers below). Is that intentional?
The circuit breaker doesn't check the time that a query takes, only the amount of memory that is created.
Loading global ordinals can be expensive on large shards/indices with high cardinality field. The doc is maybe a bit optimistic and could mention workarounds if loading is slow or if the searcher is refreshed often (each refresh of the main searcher invalidates the loaded global ordinals).
> 1. Seems like fields defined with IP datatype in the mapping take even longer to load (10-20% slower) - is there a reason for that? should we use multi-field (IP datatype for search, keyword for aggs)? Can we avoid multi-field?
The IP datatype encodes any ip in a `keyword` field so I guess that the decoding makes the loading of global ordinals slower. The `ip` field is represented as a number internally in 2.x, in 5.x we added the support for ipv6 and switched to a `keyword` representation. This means that the `terms` aggregation will use the global ordinals execution hint by default for this field. If the loading of global ordinals is too slow in your use case you can switch to the `map` execution which will be slower and requires more memory per query but doesn't require to load a shared resource on heap.
> 1. Other aggregations, most notably the date histogram aggregation, run perfectly well and very fast also on fields with very high cardinality. Is there a way to use the same technique for terms aggregation as well? in our case approximate counts will be ok too.
Date histograms work with numbers directly so they don't build global ordinals at all. The `terms` aggregation should be fast when the global ordinals are built so there's nothing that we do better in date histograms, it's just that they work on different type of data. For `keyword` field we try to avoid loading a map that contains all unique terms for each query which is why the default mode is to build the global ordinals. You can opt out from this default by setting the `execution_hint` to `map`.
> 1. The docs for the `map` execution hint state ([Terms aggregation | Elasticsearch Guide [8.11] | Elastic](https://www.elastic.co/guide/en/elasticsearch/reference/current/search-aggregations-bucket-terms-aggregation.html)): "Please note that Elasticsearch will ignore this execution hint if it is not applicable and that there is no backward compatibility guarantee on these hints." . Since the map execution hint is (currently) required for such queries to run, can the docs state those "not applicable" scenarios explicitly?
Currently it is ignored if you set the `execution_hint` to `global_ordinals` and global ordinals are not available for your source (script, field mapped as numbers, ...). `map` should always be honored.
> 1. Can global ordinals be monitored somehow? I couldn't find any obvious metric that would return the amount of memory it consumes, and in our case where significant amount of heap space is consumed, we just attribute it to global ordinals, true or not.
They are monitored in the `fielddata` stats, we could have a dedicated section but if you don't have any `text` field that loads `fielddata` then the memory reported can be attributed to global ordinals entirely.
---
### Author:  [@Itamar\_Syn\_Hershko](https://discuss.elastic.co/u/Itamar_Syn_Hershko)
#### Post date: [November 27, 2018, 2:05pm UTC](https://discuss.elastic.co/t/global-ordinals-performance-and-size-on-heap/158320/3 "2018-11-27T14:05:46Z")
Thanks so much for the prompt and very detailed answer!
Got a few follow-up questions if I may:
> [@jimczi](#):
>
> The circuit breaker doesn't check the time that a query takes, only the amount of memory that is created.
> Loading global ordinals can be expensive on large shards/indices with high cardinality field. The doc is maybe a bit optimistic and could mention workarounds if loading is slow or if the searcher is refreshed often (each refresh of the main searcher invalidates the loaded global ordinals).
Can this be improved somehow? In some systems, a very high cardinality of a field is a given situation, and executing terms agg will essentially overload the cluster. Aside from fixing the doc, maybe the circuit breaker mechanism can be revisited to be hesitant of loading global ordinals for high cardinality fields, or check why it didn't trip in our scenario (we are estimating global ordinals took ~4GB)?
> [@jimczi](#):
>
> If the loading of global ordinals is too slow in your use case you can switch to the `map` execution which will be slower and requires more memory per query but doesn't require to load a shared resource on heap.
This is exactly what we figured, except we couldn't find anywhere rule-of-thumbs for memory usage difference between map / global\_ordinals executions. Can you provide any?
Also, any plans for making global ordinals off-heap if at all possible?
> [@jimczi](#):
>
> They are monitored in the `fielddata` stats
I'm afraid that's not what we are seeing, at least not always. Currently using 6.5.1 and running the same tests we did before. We see the JVM heap grow significantly, but none of the Lucene Memory graphs grow accordingly. The fielddata stats remain very low, and loading time still spikes.
Here's a graph showing what we both expect to see - terms agg on 50m docs, on high cardinality field saved as keyword field (~80% of docs). Global ordinals are loaded relatively fast, and field data stats are shown:

The only worrying element in this graph is JVM heap shows a ~1.5GB growth but fielddata is only shown as 180MB, while no other significant workload occurs.
The first attempt, also shown in this graph, was done before - terms agg on an IP field with higher cardinality (unique term per document, almost). That aggregation took a while to run (5 minutes or so beginning ~14:20) and shows no growth in fielddata.
Then we went bigger. An index with 175m documents and a high cardinality keyword field (~80% of docs have unique value). Query execution took about 45 minutes, loaded about 10GB of data to the heap (+ one full GC) and no indication whatsoever in Lucene Memory stats:
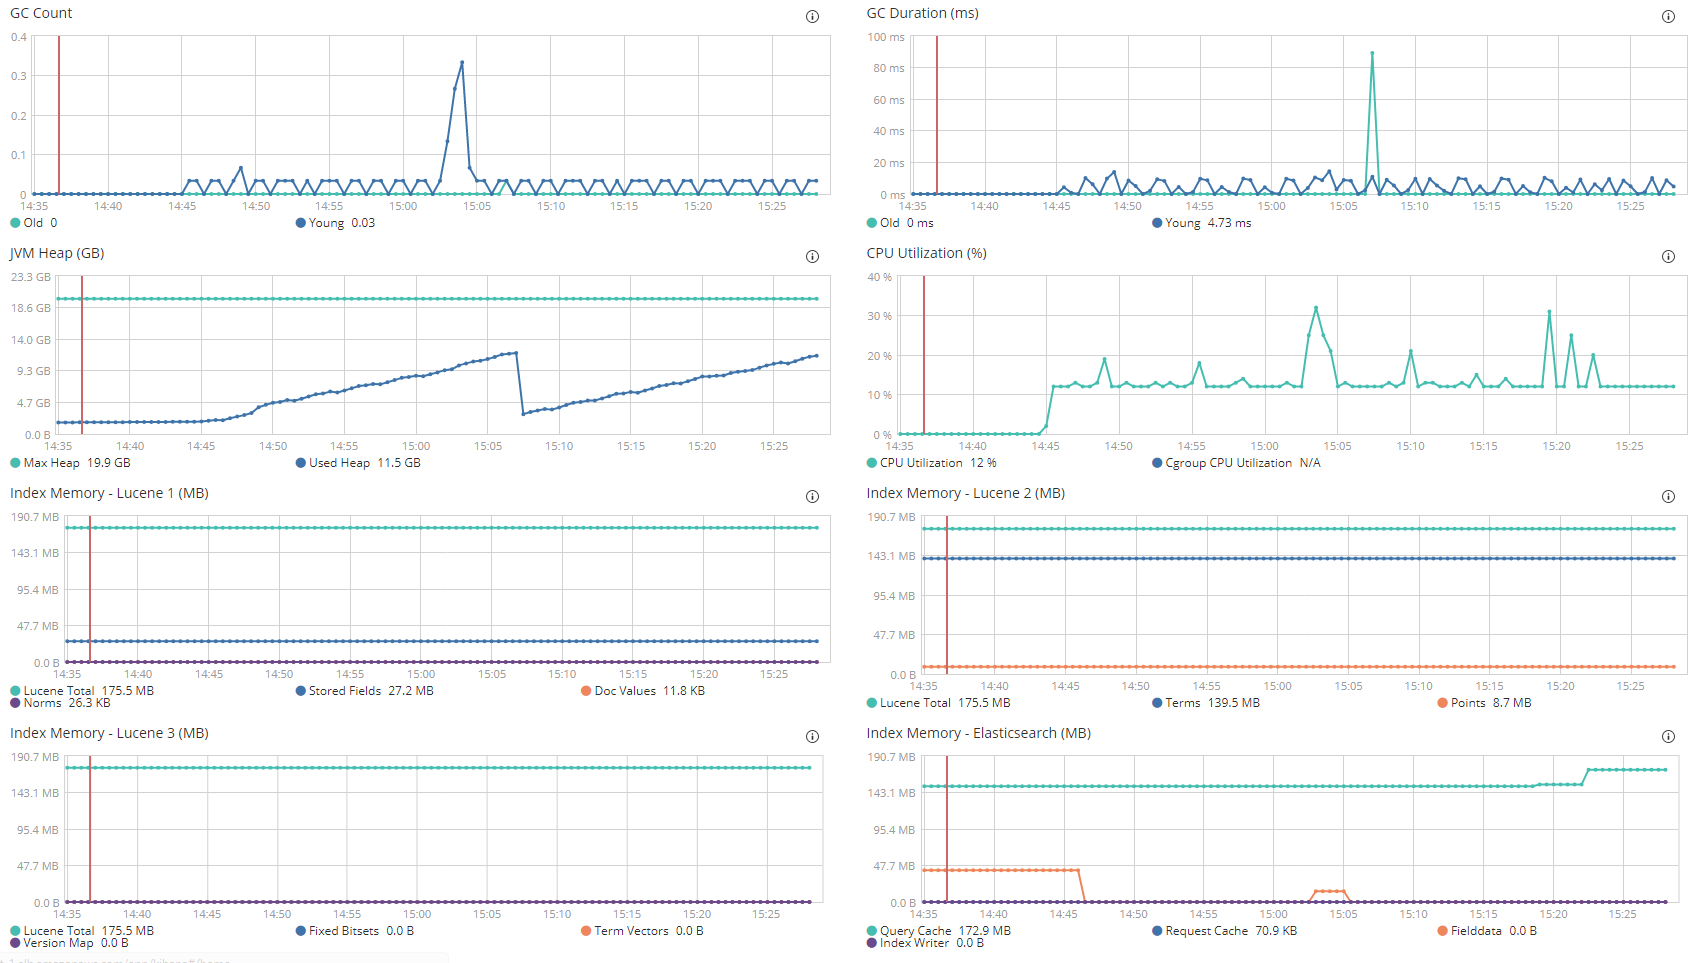
This is the use-case I referred to, and to sum it all up:
1. Stats are not showing correctly, sometimes not at all
2. Global ordinals for 175m docs take exponentially more time to load than 50m (single shard). 230m docs didn't return also after one full hour.
3. No circuit breakers triggered despite loading 10GB (maybe even more) during 45 minutes.
What do you think?
---
### Author:  [@jimczi](https://discuss.elastic.co/u/jimczi)
#### Post date: [November 27, 2018, 3:30pm UTC](https://discuss.elastic.co/t/global-ordinals-performance-and-size-on-heap/158320/4 "2018-11-27T15:30:52Z")
> [@Itamar\_Syn\_Hershko](#):
>
> I'm afraid that's not what we are seeing, at least not always. Currently using 6.5.1 and running the same tests we did before. We see the JVM heap grow significantly, but none of the Lucene Memory graphs grow accordingly. The fielddata stats remain very low, and loading time still spikes.
Yes sorry I was not clear, the memory used by global ordinals is tracked but not when they are built, only at the end when the build succeeded. This is due to the fact that the build is achieved by Lucene which doesn't have a concept of circuit breaker so we check the memory afterward.
> 1. Global ordinals for 175m docs take exponentially more time to load than 50m (single shard). 230m docs didn't return also after one full hour.
What is the size of the fielddata at the end of the loading for the 175m docs ? In the attached graph it seems that the loading is not over so this would explain why the `fielddata` is shown at 0.
> 1. No circuit breakers triggered despite loading 10GB (maybe even more) during 45 minutes.
It uses 10GB but we don't know the amount of memory that is really required. I need to do some tests to see the ratio between the memory needed to build the global ordinals and the final memory usage. Can you share a bit more of your testing deployment ? How many nodes and shards did you use for the 175M index ?
---
### Author:  [@Itamar\_Syn\_Hershko](https://discuss.elastic.co/u/Itamar_Syn_Hershko)
#### Post date: [November 28, 2018, 10:46pm UTC](https://discuss.elastic.co/t/global-ordinals-performance-and-size-on-heap/158320/5 "2018-11-28T22:46:46Z")
> [@jimczi](#):
>
> What is the size of the fielddata at the end of the loading for the 175m docs ?
The graphs shown were captured after the initial loading is finished. We waited for the query to return (for as long as it took), executed the query again to verify it returns instantaneously (with caches disabled) and then captured the screenshots. Not seeing the fielddata graph spike was exactly my wtf moment as well 🙂
Like I wrote previously, the JVM heap memory usage is the only indication we have for how much memory that process took. I believe we are talking GBs of data, and that is exactly why I was surprised there was no circuit breakers involved.
Hopefully this is all clear now.
> [@jimczi](#):
>
> This is due to the fact that the build is achieved by Lucene which doesn't have a concept of circuit breaker
Maybe that's the culprit then?
> [@jimczi](#):
>
> Can you share a bit more of your testing deployment ? How many nodes and shards did you use for the 175M index ?
I wrote the machine specs etc above in detail. Single shard on a 3 master 3 data cluster, no replicas, so we had a quiet server to test on. Which more info do you need?
---
### Author:  [@jimczi](https://discuss.elastic.co/u/jimczi)
#### Post date: [November 29, 2018, 12:48am UTC](https://discuss.elastic.co/t/global-ordinals-performance-and-size-on-heap/158320/6 "2018-11-29T00:48:51Z")
50 minutes to load the global ordinals of (175/3)M documents seem very high, 15-20 minutes to load 70M too.
I tested with a keyword field on 30M docs and the global ordinals are loaded in 30s on my laptop. Can you share some hot threads of the nodes when the global ordinals are loading ? Can you also share the query that you use for your tests and some sample data ?
---
### Author:  [@Itamar\_Syn\_Hershko](https://discuss.elastic.co/u/Itamar_Syn_Hershko)
#### Post date: [November 29, 2018, 6:51am UTC](https://discuss.elastic.co/t/global-ordinals-performance-and-size-on-heap/158320/7 "2018-11-29T06:51:21Z")
I agree. What we saw is exponential growth in the time it takes to load global ordinals for high cardinality fields, so 30M docs with a field with 30M unique values might take 30s but 70M will take much longer.
The query was a simple terms aggregation on the high cardinality field, with match\_all or any other type of query. We can send hot\_threads next week.
We can share our full sample data we use for testing (on S3), we can send details privately.
---
### Author:  [@system](https://discuss.elastic.co/u/system)
#### Post date: [December 27, 2018, 6:51am UTC](https://discuss.elastic.co/t/global-ordinals-performance-and-size-on-heap/158320/8 "2018-12-27T06:51:23Z")
This topic was automatically closed 28 days after the last reply. New replies are no longer allowed.
---
### Author:  [@jimczi](https://discuss.elastic.co/u/jimczi)
#### Post date: [January 18, 2019, 3:23pm UTC](https://discuss.elastic.co/t/global-ordinals-performance-and-size-on-heap/158320/9 "2019-01-18T15:23:28Z")
Hi,
Sorry for the late reply.
I tried to reproduce with your data but the results I got are completely different. Loading the global ordinals on the source\_ip field for 150M documents on a single shard takes 30s on my macbook. Running a terms aggregation with the default option on that field when the global ordinals are loaded takes 52s. So overall that's 80s to run a terms aggregation on this high cardinality field. I also checked the size of the global ordinal in the heap and the size matches with the one reported in the fielddata stats (750 mb so 4 bytes per document). These numbers are far from the one you shared so I wonder what is limiting in your setup.
Can you take a few hot\_threads when the slow query is running and share the output here ? 45 minutes seems a lot especially if the memory growth is linear during the query. With global ordinals in place this shouldn't be the case since we allocate a single big array for the whole request. Are you sure that you didn't test with the `map` execution hint ?
---
### Author:  [@Alex\_Marquardt](https://discuss.elastic.co/u/Alex_Marquardt)
#### Post date: [February 6, 2019, 7:10pm UTC](https://discuss.elastic.co/t/global-ordinals-performance-and-size-on-heap/158320/10 "2019-02-06T19:10:45Z")
> [@Itamar\_Syn\_Hershko](#):
>
> > If the loading of global ordinals is too slow in your use case you can switch to the `map` execution which will be slower and requires more memory per query but doesn't require to load a shared resource on heap.
Hi all,
If you are running a query before the terms aggregation that only returns a small number of results (eg. thousands), then in some cases it may be useful to avoid building global ordinals all together.
However, in some versions before 6.7 (perhaps all?), the 'map' hint does not prevent the building of global ordinals. See the following bug report and code fix:
>
>
> (corrected description) 'execution\_hint': 'map' loads global ordinals, even thou…gh they are not required. This feature is \[documented here\](https://www.elastic.co/guide/en/elasticsearch/reference/current/search-aggregations-bucket-terms-aggregation.html#search-aggregations-bucket-terms-aggregation-execution-hint).
>
> I have a client with an index containing hundreds of millions of documents. Within this index, there is a high cardinality field with hundreds of millions of possible values. When the client executes a query that matches a few hundred documents, and then runs a terms aggregation on the high-cardinality field, Elastic will rebuild global ordinals, which can take 15 seconds (In-fact it even does this rebuild of the global ordinals if the query matched zero documents).There are several options for solving this issue:
>
> 1. wait 15 seconds to build global ordinals on execution of the aggregation (not acceptable, and not a real solution)
>
> 1. enable eager global ordinals and increase the refresh interval to minimize the impact of constant rebuilding of global ordinals (which is not ideal due to having to wait to see results, and the constant work of rebuilding global ordinals)
>
> 1. use ‘map’ to only evaluate documents that match the query when running the terms aggregation (doesn’t work)
>
> 1. do a hack - use a script to return the value for the terms aggregation, which forces global ordinals to be ignored as they don't exist for a script-generated field (this works, but feels hackey).
>
> To give context, this is for a bank. A given client will want to see all the IBAN numbers they have transfered to. There are hundreds of millions of IBAN numbers, but each client will have only used on the order of hundreds.
>
> I am currently using option (4) to work around the fact that (3) does not work. Ideally I would like to use (3) execution\_hint: map to solve this issue.
>
> This was discussed in the #elasticsearch slack channel on Jan 22, 2019
>
>
> The \`terms\` aggregator loads the global ordinals to retrieve the cardinality of …the field to aggregate on. This information is then used to select the strategy to use for the aggregation (\`breadth\_first\` or \`depth\_first\`). However this should be avoided if the \`execution\_hint\` is explicitly set to \`map\` since this mode doesn't really need the global ordinals. Since we still need the cardinality of the field this change picks the maximum cardinality in the segments as an estimation of the total cardinality to select the strategy to use (\`breadth\_first\` or \`depth\_first\`). This estimation is only used if the execution hint is set to \`map\`, otherwise the global ordinals are still used to retrieve the accurate cardinality.
>
> Closes #37705
In the meantime, the following hack can avoid building global ordinals, but should only be used if the aggregation is on a small subset of the documents (i.e. after a query has filtered down the number of documents to run the terms aggregation on):
If the original aggregation looks as follows:
```
“aggregations”: {
“top-uids”: {
“terms”: {
“field”: “field_name.keyword”,
etc....
```
The new query that avoids building Global Ordinals is the following:
```
“aggregations”: {
“top-uids”: {
“terms”: {
“script” : {
“source”: “doc[‘field_name.keyword’].value”,
“lang”: “painless”
}
etc...
```
I just noticed that it was @jimczi that fixed the code in 6.7 and 7.0 so that this hack would not be required, and that the 'execution\_hint': 'map' could be used instead.