# Help with a visualization
**URL:** https://discuss.elastic.co/t/help-with-a-visualization/301267
**Category:** Kibana
**Created:** [March 31, 2022, 9:59pm UTC](https://discuss.elastic.co/t/help-with-a-visualization/301267 "2022-03-31T21:59:39Z")
**Posts on this page:** 3
**Page:** 1
### Author:  [@edu\_perez\_alvarez](https://discuss.elastic.co/u/edu_perez_alvarez)
#### Post date: [March 31, 2022, 9:59pm UTC](https://discuss.elastic.co/t/help-with-a-visualization/301267/1 "2022-03-31T21:59:40Z")
Hello!
I have a simple visualization in a dashboard. X-axis is the @timestamp. Y-axis is a MetricValue of a service. I want to add another visualization (another graphic) with the same X-axis. Here, the MetricValue for each @timestamp has to be the average value of the MetricValue in the last 3 weeks for that @timestamp.
In other words, for example, if @timestamp is 28-03-2022 12:30, the MetricValue I want to visualize is (MetricValue(@timestamp=21-03-12:30) + MetricValue(@timestamp=14-03-12:30) + MetricValue(@timestamp=07-03-12:30))/3 . I don't know how to carry out this.
Can anyone help me ? I would be very grateful
---
### Author:  [@Marta\_Bondyra](https://discuss.elastic.co/u/Marta_Bondyra)
#### Post date: [April 4, 2022, 8:15am UTC](https://discuss.elastic.co/t/help-with-a-visualization/301267/2 "2022-04-04T08:15:00Z")
Hi @edu_perez_alvarez,
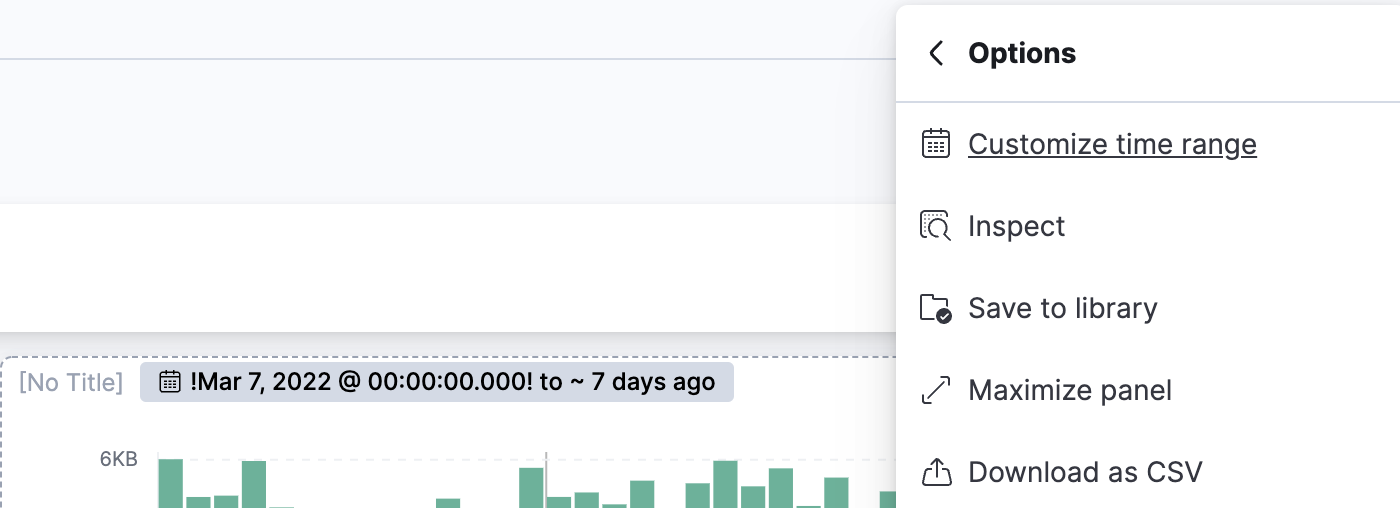
so the only difference between the panels are different time ranges? You could customize the time range in a single visualization in your dashboard:
Here's the two visualizations side by side:

If using Lens, there's also a useful feature of [timeshift](https://www.elastic.co/guide/en/kibana/current/lens.html#compare-data-with-time-offsets) if the solution above doesn't satisfy your needs. Let me know!
---
### Author:  [@system](https://discuss.elastic.co/u/system)
#### Post date: [May 2, 2022, 8:15am UTC](https://discuss.elastic.co/t/help-with-a-visualization/301267/3 "2022-05-02T08:15:54Z")
This topic was automatically closed 28 days after the last reply. New replies are no longer allowed.