# Histogram Visualization from Prometheus data?
**URL:** https://discuss.elastic.co/t/histogram-visualization-from-prometheus-data/294457
**Category:** Kibana
**Created:** [January 14, 2022, 9:39pm UTC](https://discuss.elastic.co/t/histogram-visualization-from-prometheus-data/294457 "2022-01-14T21:39:14Z")
**Posts on this page:** 2
**Page:** 1
### Author:  [@DarkMagus](https://discuss.elastic.co/u/DarkMagus)
#### Post date: [January 14, 2022, 9:39pm UTC](https://discuss.elastic.co/t/histogram-visualization-from-prometheus-data/294457/1 "2022-01-14T21:39:14Z")
I have some data that's being exported from Prometheus as a histogram object. The data itself is how long a particular job takes to process, so the buckets are in 30 second intervals. I'm getting data from my containers that looks like this (as expected the histogram has both \_count & \_values arrays).

I'm trying to visualize this as a vertical bar chart (histogram) - here's how I have it set up:
- Y-Axis - **Sum** of \_counts field
- X-Axis - Histogram aggregation, on the \_values field.
Screenshot:
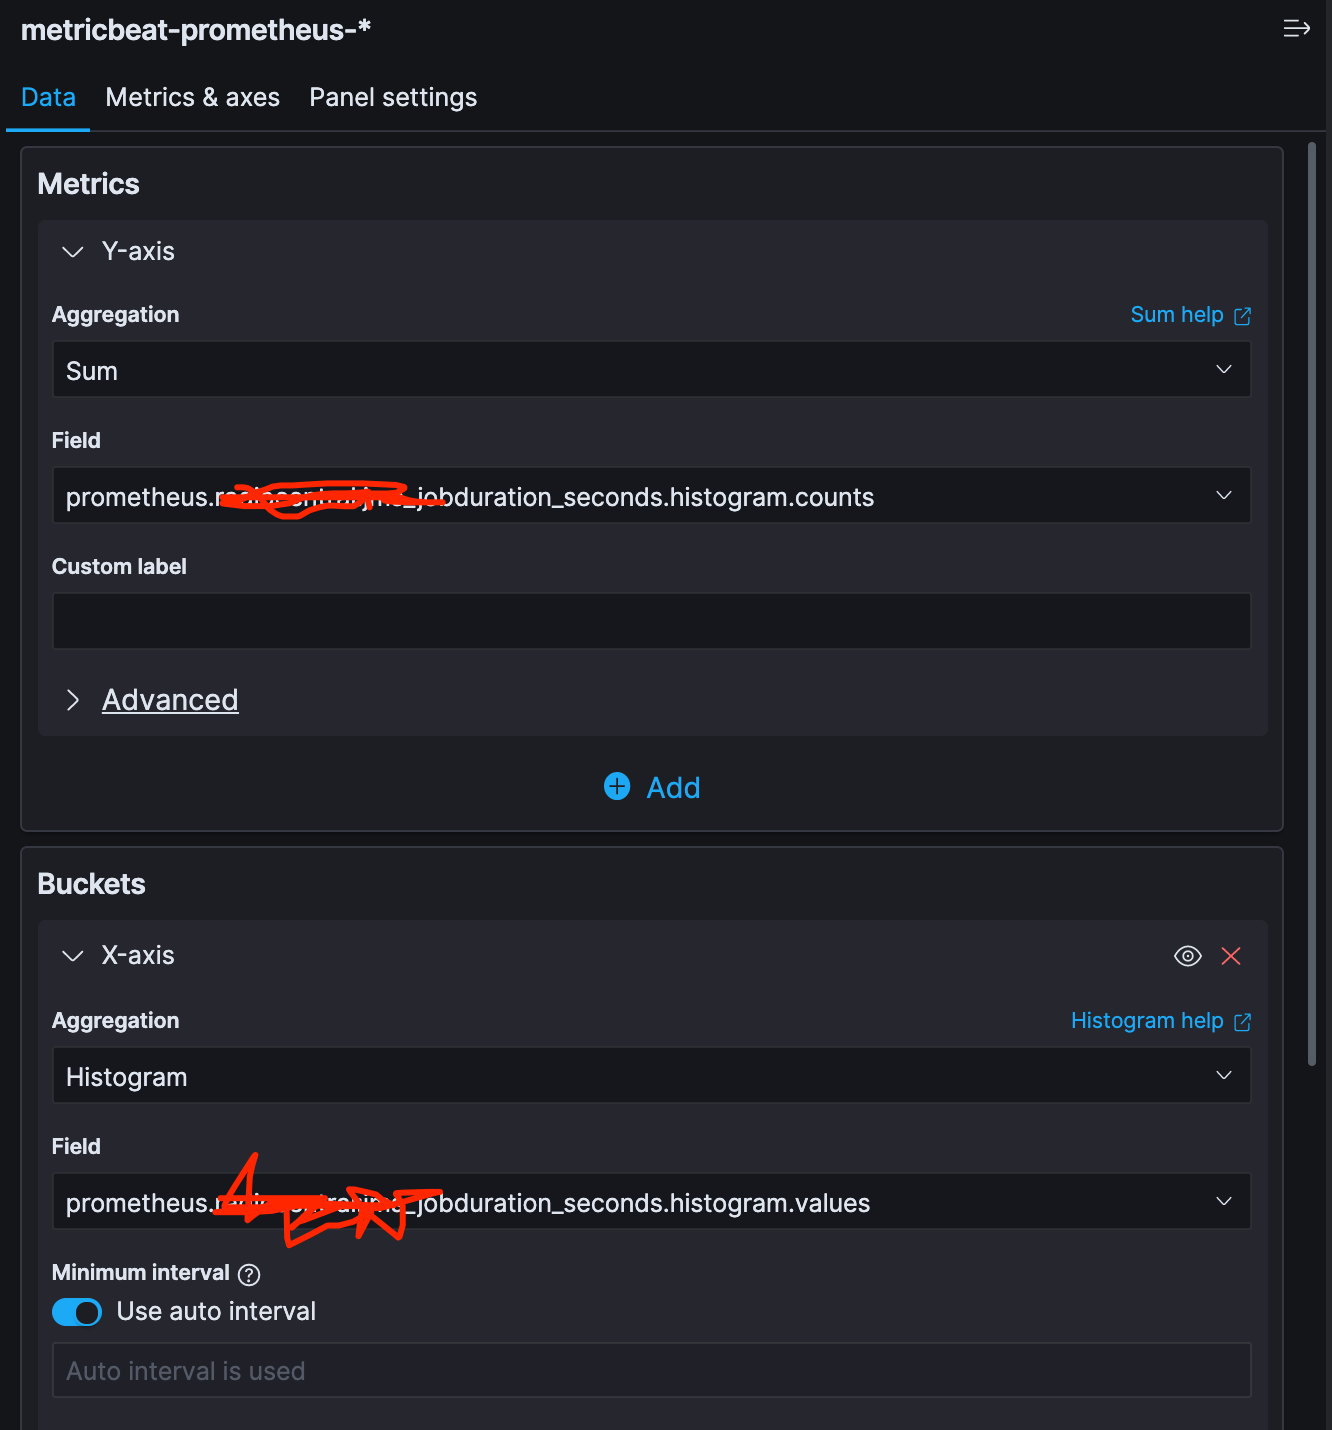
However, the results aren't what I'm expecting. Based on the sample data in the screenshot there are lots of buckets that have 0 values, and only a few buckets that have actual counts in them. So I'm not expecting to see this:

Any idea on what I'm doing wrong? I'm only minimally familiar with Kibana. Thanks!
---
### Author:  [@system](https://discuss.elastic.co/u/system)
#### Post date: [February 11, 2022, 9:40pm UTC](https://discuss.elastic.co/t/histogram-visualization-from-prometheus-data/294457/2 "2022-02-11T21:40:01Z")
This topic was automatically closed 28 days after the last reply. New replies are no longer allowed.