# How to collect Jenkins data using openetelemetry plugin
**URL:** https://discuss.elastic.co/t/how-to-collect-jenkins-data-using-openetelemetry-plugin/379236
**Category:** APM
**Tags:** open-telemetry
**Created:** [June 17, 2025, 10:14am UTC](https://discuss.elastic.co/t/how-to-collect-jenkins-data-using-openetelemetry-plugin/379236 "2025-06-17T10:14:40Z")
**Posts on this page:** 3
**Page:** 1
### Author:  [@Fahiqa](https://discuss.elastic.co/u/Fahiqa)
#### Post date: [June 17, 2025, 10:14am UTC](https://discuss.elastic.co/t/how-to-collect-jenkins-data-using-openetelemetry-plugin/379236/1 "2025-06-17T10:14:40Z")
Could someone please guide me with the steps to fetch Jenkins logs using the OpenTelemetry plugin and display the metrics in Kibana? I have already configured Elasticsearch and Kibana in my Kubernetes cluster.
---
### Author:  [@Tortoise](https://discuss.elastic.co/u/Tortoise)
#### Post date: [June 17, 2025, 11:56am UTC](https://discuss.elastic.co/t/how-to-collect-jenkins-data-using-openetelemetry-plugin/379236/2 "2025-06-17T11:56:47Z")
Hello @Fahiqa
Welcome to the community.
To start with you can review below blog :
> [@Sending jenkins metrics to elastic APM](https://discuss.elastic.co/t/sending-jenkins-metrics-to-elastic-apm/316727):
>
> If you are asking about a problem you are experiencing, please use the following template, as it will help us help you. If you have a different problem, please delete all of this text slight_smile TIP 1: select at least one tag that further categorizes your topic. For example server for APM Server related questions, java for questions regarding the Elastic APM Java agent, or ui for questions about the APM App within Kibana. TIP 2: Check out the [troubleshooting guide](https://www.elastic.co/guide/en/apm/get-started/current/troubleshooting.html) first. Not only will it h…
Thanks!!
---
### Author:  [@Fahiqa](https://discuss.elastic.co/u/Fahiqa)
#### Post date: [June 19, 2025, 5:59am UTC](https://discuss.elastic.co/t/how-to-collect-jenkins-data-using-openetelemetry-plugin/379236/3 "2025-06-19T05:59:55Z")
Hi @Tortoise
I have completed the backend setup using the following manifest files: apmServer/apmIngress/apmService/oTel-deployment and config/oTelIngress/otelService. All manifests have been successfully deployed and are currently running, confirmed by a status 200 response in the CLI.
In Jenkins, I configured the OTLP endpoint to point to the oTel Ingress URL and set the Kibana URL as the Kibana endpoint. After creating and triggering a sample pipeline, the pipeline status shows as green. However, when I click on "Open Telemetry View" under "View Pipeline with Elastic Observability," it redirects to Kibana, where no data is displayed and the message "No data to display" appears.

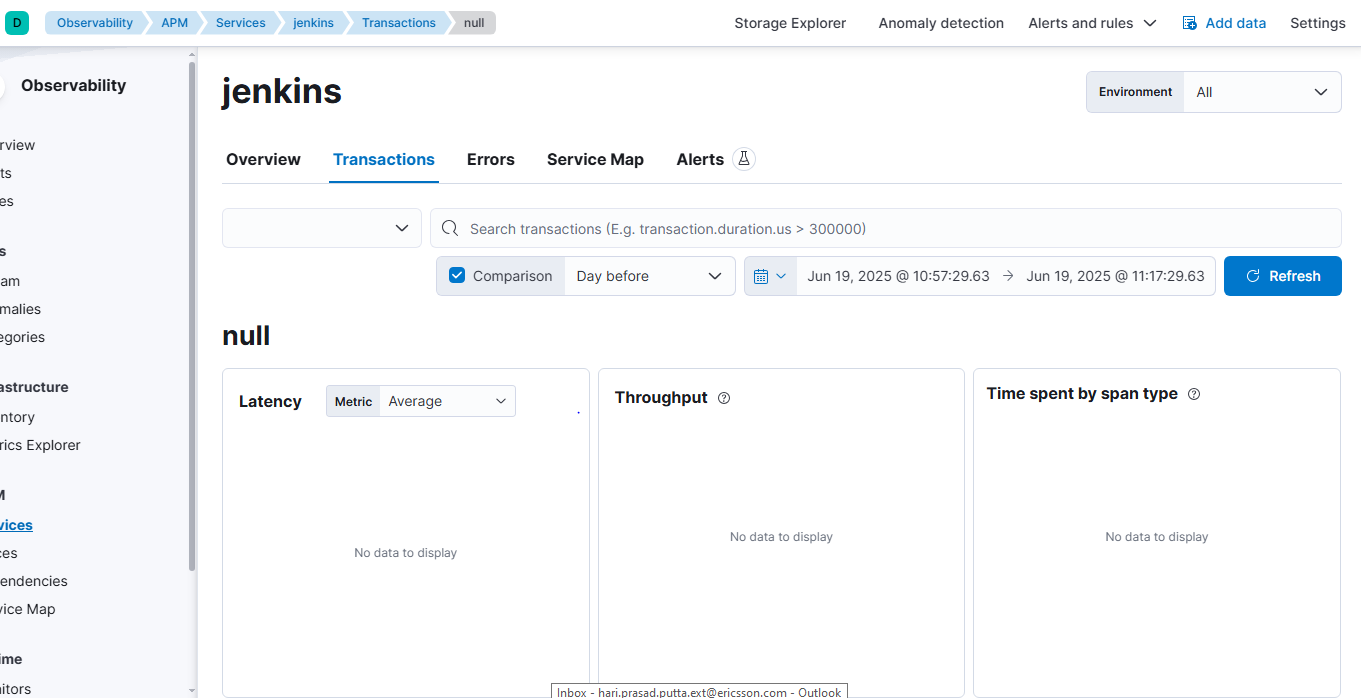
Also upon selecting "Store pipeline logs in Elastic" and "Visualize logs both in Elastic and through Jenkins", the logs are not appearing in Jenkins.