# Increasing elasticsearch indexing rate
**URL:** https://discuss.elastic.co/t/increasing-elasticsearch-indexing-rate/74071
**Category:** Elasticsearch
**Created:** [February 6, 2017, 2:44pm UTC](https://discuss.elastic.co/t/increasing-elasticsearch-indexing-rate/74071 "2017-02-06T14:44:21Z")
**Posts on this page:** 15
**Page:** 1
### Author:  [@Zeeshan\_Alam](https://discuss.elastic.co/u/Zeeshan_Alam)
#### Post date: [February 6, 2017, 2:44pm UTC](https://discuss.elastic.co/t/increasing-elasticsearch-indexing-rate/74071/1 "2017-02-06T14:44:21Z")
I have created a 3 node cluster, 1 Master Node, 1 Coordinating Node and 1 Data Node.
I am using **Logstash 2.4** , **Elasticsearch 5.2** and **Kibana 5.2**.
Logstash is reading data from Kafka and sending it to the ingest node. I am not doing any data processing in logstash or in the Coordinating Node.
All are Citrix VM having same configuration of :
> Red Hat Linux-7
> Intel(R) Xeon(R) CPU E5-2630 v3 @ 2.40GHz 6 Cores
> 32 GB RAM
> 2 TB spinning media
**Logstash Config file :**
```
input {
kafka {
zk_connect=>"kfk1:2181,kfk2:2181,kfk3:2181"
white_list => "topic_name"
group_id => "consumer_group_name"
codec => avro {
schema_uri => "/apps/schema/rocana3.schema"
}
}
}
output {
elasticsearch {
hosts => ["coordinating_node:9200"]
flush_size => 50000
index => "logstash-applogs-test3"
user => "elastic"
password => "changeme"
}
}
```
And I am running logstash by:
> LS\_HEAP\_SIZE=12g nohup ./logstash -f myconfig.conf -b 10000 -u 1000 -v &
Elasticsearch Data Node's **elastcisearch.yml** File:
```
cluster.name: my-cluster-name
node.name: data-1
node.master: false
node.data: true
bootstrap.memory_lock: true
path.data: /apps/dataES/data
path.logs: /apps/dataES/logs
discovery.zen.ping.unicast.hosts: ["master1"]
thread_pool.bulk.queue_size : 2000
network.host: hostname
http.port: 9200
The only change that I made in my **jvm.options** file is
-Xms15g
-Xmx15g
```
System config changes that I did are as follows:
`vm.max_map_count=262144`
and in /etc/security/limits.conf I added :
```
elastic soft nofile 65536
elastic hard nofile 65536
elastic soft memlock unlimited
elastic hard memlock unlimited
elastic soft nproc 65536
elastic hard nproc unlimited
```
**Indexing Rate**
The maximum indexing rate that I get is 4000 documents/second

_ **Click on the image for more details** _
**Data Node usage:**
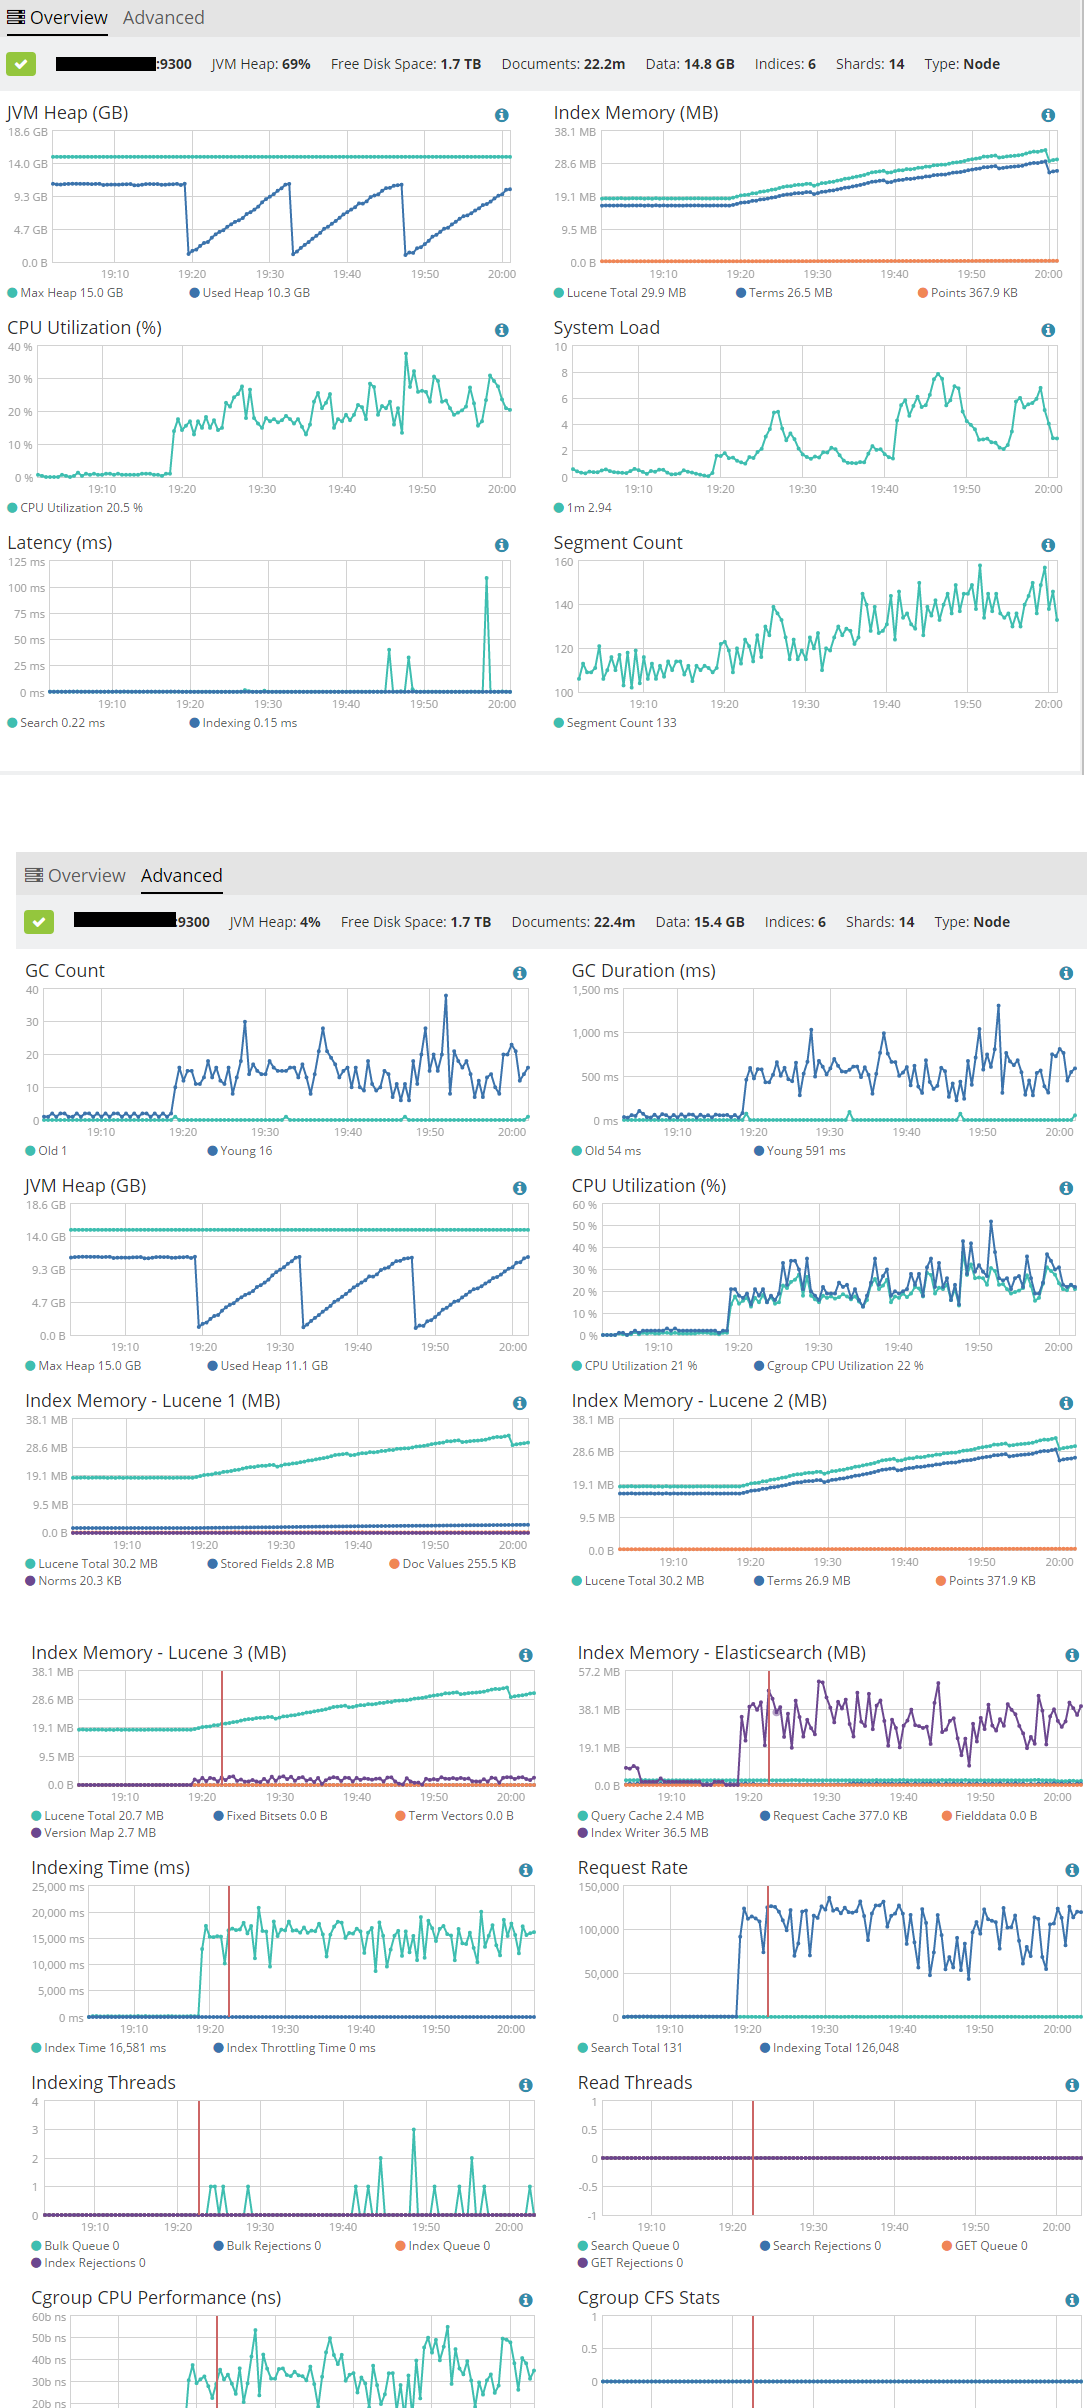
_ **Click on the image for more details** _
I would like to increase the indexing rate more as I tried dumping data from Logstash to disk and got a 461MB file with 752586 events in 60 seconds. So logstash is reading around 12,500 events per second but elasticsearch is indexing around 4,000 events per second.
---
### Author:  [@Zeeshan\_Alam](https://discuss.elastic.co/u/Zeeshan_Alam)
#### Post date: [February 6, 2017, 3:25pm UTC](https://discuss.elastic.co/t/increasing-elasticsearch-indexing-rate/74071/2 "2017-02-06T15:25:09Z")
**I installed Packetbeats in logstash machine to see how much data was being sent.**
This is what I am getting in kibana:
```
{
"@timestamp": "2017-02-06T14:54:02.448Z",
"beat": {
"hostname": "logstash-host",
"name": "logstash-host",
"version": "5.2.0"
},
"bytes_in": 25697,
"bytes_out": 438,
"client_ip": "logstash-host-ip-address",
"client_port": 55421,
"client_proc": "",
"client_server": "",
"direction": "out",
"http": {
"request": {
"headers": {
"content-length": 25445,
"content-type": "text/plain; charset=ISO-8859-1"
},
"params": ""
},
"response": {
"code": 200,
"headers": {
"content-length": 303,
"content-type": "application/json; charset=UTF-8"
},
"phrase": "OK"
}
},
"ip": "elastic-coordinating-node-ip",
"method": "POST",
"path": "/_bulk",
"port": 9200,
"proc": "",
"query": "POST /_bulk",
"responsetime": 14,
"server": "",
"status": "OK",
"type": "http"
}
```
I created a kibana visualization of sum of content-length:

I don't see logstash sending much data to my elasticserach
---
### Author:  [@Christian\_Dahlqvist](https://discuss.elastic.co/u/Christian_Dahlqvist)
#### Post date: [February 6, 2017, 6:12pm UTC](https://discuss.elastic.co/t/increasing-elasticsearch-indexing-rate/74071/3 "2017-02-06T18:12:06Z")
The first thing I would recommend changing is your Elasticsearch cluster topology. Start simple and set up a single node that is master eligible and holds data. For a cluster this size it generally does not make any sense to configure dedicated node types. Just because you can do it does not mean you should.
Some of the values you have configured for Logstash also seem excessive. Larger values does not necessarily result in better performance. I would recommend reducing the flush\_size for the Elasticsearch output plugin to 1000 and adjust the internal batch size down from 10000 to 1000 as well.
As you are using Logstash 2.4 and not 5.2, I believe you also need to specify the number of output workers for the Elasticsearch output plugin. Set this to the number of cores on you Logstash node.
VMs can have varying performance. Indexing in Elasticsearch is generally both CPU and IO intensive. Verify that the VM actually has access to the resources you have configured and that the host is not over provisioned with respect to CPU and memory. Memory ballooning can have a serious impact on performance. It is also worth checking the performance of the underlying storage.
Judging performance based on just events per second is vey hard as the size of the events matters. What is the average size of your events?
---
### Author:  [@anhlqn](https://discuss.elastic.co/u/anhlqn)
#### Post date: [February 6, 2017, 7:34pm UTC](https://discuss.elastic.co/t/increasing-elasticsearch-indexing-rate/74071/4 "2017-02-06T19:34:58Z")
> [@Zeeshan\_Alam](#):
>
> LS\_HEAP\_SIZE=12g
@Christian_Dahlqvist Is this also too high? I remember that I could easily index 40K EPS netflow data from Logstash to Elasticsearch with 2GB heap size for Logstash and a single ES node.
---
### Author:  [@Christian\_Dahlqvist](https://discuss.elastic.co/u/Christian_Dahlqvist)
#### Post date: [February 6, 2017, 7:36pm UTC](https://discuss.elastic.co/t/increasing-elasticsearch-indexing-rate/74071/5 "2017-02-06T19:36:00Z")
Yes, that also looks quite high...
---
### Author:  [@Zeeshan\_Alam](https://discuss.elastic.co/u/Zeeshan_Alam)
#### Post date: [February 7, 2017, 1:23pm UTC](https://discuss.elastic.co/t/increasing-elasticsearch-indexing-rate/74071/6 "2017-02-07T13:23:18Z")
Hi @Christian_Dahlqvist
Thanks for looking into it.
My average event size is around 700Bytes to 1KB
I changed my topology with 1 Data and 1 Master node, and am pushing data directly to the data node from logstash with `flush_size => 1000` and `workers => 6`
> LS\_HEAP\_SIZE=2g nohup ./logstash -f myconfig.conf -b 1000 -v &

I added consumer\_threads =\> 6 in logstash input \> kafka but didn't saw any difference.

I also tried `flush_size => 2000` and `batch size : 2000` and didn't got any improvement.
So I thought that maybe I am not able to read data fast enough from Kafka so I first created a 2 GB file of the Kafta events in the logstash server.
Created a local file, got a 2.2 GB file with 3183556 events in four minutes.
```
input {
kafka {
zk_connect=>"kfk1:2181,kfk2:2181,kfk3:2181"
white_list => "topic_name"
group_id => "consumer_group_name"
codec => avro {
schema_uri => "/apps/schema/rocana3.schema"
}
}
}
output {
file {
path => "/apps/elk/test/dump.txt"
}
}
```
Then I sent the content of this file from to elasticsearch.
```
input {
file {
path => "/apps/elk/test/dump.txt"
start_position => "beginning"
}
}
output {
elasticsearch {
hosts => ["datanode:9200"]
flush_size => 1000
workers => 6
index => "logstash-applogs-test4"
}
}
```
This is what I got:
From **Logstash 2.4**

From **Logstash 5.2.0**

Then I thought that elasticsearch is throttling logstash. So I checked elastic logs and everything looks good there:
```
[2017-02-07T04:04:59,209][INFO][o.e.m.j.JvmGcMonitorService] [data-1] [gc][3656] overhead, spent [292ms] collecting in the last [1s]
[2017-02-07T04:06:29,355][INFO][o.e.m.j.JvmGcMonitorService] [data-1] [gc][3746] overhead, spent [262ms] collecting in the last [1s]
[2017-02-07T04:07:10,435][INFO][o.e.m.j.JvmGcMonitorService] [data-1] [gc][3787] overhead, spent [268ms] collecting in the last [1s]
[2017-02-07T04:07:31,471][INFO][o.e.m.j.JvmGcMonitorService] [data-1] [gc][3808] overhead, spent [252ms] collecting in the last [1s]
[2017-02-07T04:23:39,975][INFO][o.e.m.j.JvmGcMonitorService] [data-1] [gc][4769] overhead, spent [304ms] collecting in the last [1s]
[2017-02-07T04:25:26,062][INFO][o.e.m.j.JvmGcMonitorService] [data-1] [gc][4875] overhead, spent [262ms] collecting in the last [1s]
[2017-02-07T04:35:09,446][INFO][o.e.m.j.JvmGcMonitorService] [data-1] [gc][5450] overhead, spent [276ms] collecting in the last [1s]
[2017-02-07T06:21:13,786][INFO][o.e.m.j.JvmGcMonitorService] [data-1] [gc][11784] overhead, spent [323ms] collecting in the last [1s]
```
I also tested the bandwitdh between my Logstash server and the Data node using **iperf 3.1.3** and this is what I got:
```
> Test Complete. Summary Results:
> [ID] Interval Transfer Bandwidth Retr
> [4] 0.00-60.00 sec 13.1 GBytes 1.88 Gbits/sec 597 sender
> [4] 0.00-60.00 sec 13.1 GBytes 1.88 Gbits/sec receiver
> CPU Utilization: local/sender 77.6% (0.1%u/77.4%s), remote/receiver 53.2% (1.4%u/51.8%s)
```
And this is the ping:
```
64 bytes from: icmp_seq=1 ttl=64 time=0.262 ms
64 bytes from: icmp_seq=2 ttl=64 time=0.252 ms
64 bytes from: icmp_seq=3 ttl=64 time=0.299 ms
20 packets transmitted, 20 received, 0% packet loss, time 18999ms
rtt min/avg/max/mdev = 0.200/0.286/0.357/0.043 ms
```
So I can expect maximum indexing of 10000 events/second from a single node cluster or there is any scope of improvement?
---
### Author:  [@Zeeshan\_Alam](https://discuss.elastic.co/u/Zeeshan_Alam)
#### Post date: [February 7, 2017, 1:25pm UTC](https://discuss.elastic.co/t/increasing-elasticsearch-indexing-rate/74071/7 "2017-02-07T13:25:47Z")
Hi @anhlqn,
Thanks for the reply. You were achieving 40k per second? What was the configuration of your ES node?
---
### Author:  [@Christian\_Dahlqvist](https://discuss.elastic.co/u/Christian_Dahlqvist)
#### Post date: [February 7, 2017, 1:29pm UTC](https://discuss.elastic.co/t/increasing-elasticsearch-indexing-rate/74071/8 "2017-02-07T13:29:06Z")
Have you identified what is the limiting factor on the Elasticsearch data node? What does CPU usage, disk I/O and iowait look like during indexing? Do you se anything about either GC or merge throttling in the Elasticsearch logs?
---
### Author:  [@Zeeshan\_Alam](https://discuss.elastic.co/u/Zeeshan_Alam)
#### Post date: [February 7, 2017, 2:14pm UTC](https://discuss.elastic.co/t/increasing-elasticsearch-indexing-rate/74071/9 "2017-02-07T14:14:15Z")
Hi @Christian_Dahlqvist
This is what I am got from X-Pack monitoring:
**Indexing Rate:** (click on the image to expand)

**Data Node usage:** (click on the image to expand)

**Data node memory usage:**
```
free -h
total used free shared buff/cache available
Mem: 31G 16G 683M 24M 14G 14G
Swap: 4.0G 165M 3.8G
```
In elasticsearch Data Node logs:
```
[2017-02-07T04:04:59,209][INFO][o.e.m.j.JvmGcMonitorService] [data-1] [gc][3656] overhead, spent [292ms] collecting in the last [1s]
[2017-02-07T04:06:29,355][INFO][o.e.m.j.JvmGcMonitorService] [data-1] [gc][3746] overhead, spent [262ms] collecting in the last [1s]
[2017-02-07T04:07:10,435][INFO][o.e.m.j.JvmGcMonitorService] [data-1] [gc][3787] overhead, spent [268ms] collecting in the last [1s]
[2017-02-07T04:07:31,471][INFO][o.e.m.j.JvmGcMonitorService] [data-1] [gc][3808] overhead, spent [252ms] collecting in the last [1s]
[2017-02-07T04:23:39,975][INFO][o.e.m.j.JvmGcMonitorService] [data-1] [gc][4769] overhead, spent [304ms] collecting in the last [1s]
[2017-02-07T04:25:26,062][INFO][o.e.m.j.JvmGcMonitorService] [data-1] [gc][4875] overhead, spent [262ms] collecting in the last [1s]
[2017-02-07T04:35:09,446][INFO][o.e.m.j.JvmGcMonitorService] [data-1] [gc][5450] overhead, spent [276ms] collecting in the last [1s]
[2017-02-07T06:21:13,786][INFO][o.e.m.j.JvmGcMonitorService] [data-1] [gc][11784] overhead, spent [323ms] collecting in the last [1s]
```
---
### Author:  [@anhlqn](https://discuss.elastic.co/u/anhlqn)
#### Post date: [February 8, 2017, 7:08am UTC](https://discuss.elastic.co/t/increasing-elasticsearch-indexing-rate/74071/10 "2017-02-08T07:08:35Z")
> [@Zeeshan\_Alam](#):
>
> Thanks for the reply. You were achieving 40k per second? What was the configuration of your ES node?
I don't remember the config for 40K but do have numbers for up to 25K EPS
Netflow Generator \> Logstash 2.2.0 \> Elasticsearch 2.2.0
- 1 physical server with 16GB RAM, 1x 6-core Xeon E5-2620, 4x 300GB SSD
- 1 ES node with 8GB heap size
- 1 index with 2 shards 0 repl
- Netflow data were generated at 40K per sec
Adding 1 repl and indexing for a long time may decrease performance. However, at that time I did not know how to tune Logstash config to increase throughput, so Logstash might be the bottleneck.
---
### Author:  [@Zeeshan\_Alam](https://discuss.elastic.co/u/Zeeshan_Alam)
#### Post date: [February 8, 2017, 7:24am UTC](https://discuss.elastic.co/t/increasing-elasticsearch-indexing-rate/74071/11 "2017-02-08T07:24:10Z")
@anhlqn
How do you know when Logstash becomes a bottleneck, does this information is been written to some logs? and how did you fine tuned your logstash?
---
### Author:  [@anhlqn](https://discuss.elastic.co/u/anhlqn)
#### Post date: [February 9, 2017, 5:51am UTC](https://discuss.elastic.co/t/increasing-elasticsearch-indexing-rate/74071/12 "2017-02-09T05:51:28Z")
> [@Zeeshan\_Alam](#):
>
> How do you know when Logstash becomes a bottleneck, does this information is been written to some logs? and how did you fine tuned your logstash?
No, for older version I don't see/know where to find this information. I started with 1 Flow generator and 1 LS. When I saw the indexing rate in ES became stable, I added another generator + LS, and index rate increased.
You can find LS performance tuning here [Performance Troubleshooting | Logstash Reference [8.11] | Elastic](https://www.elastic.co/guide/en/logstash/current/performance-troubleshooting.html)
---
### Author:  [@Zeeshan\_Alam](https://discuss.elastic.co/u/Zeeshan_Alam)
#### Post date: [February 9, 2017, 2:31pm UTC](https://discuss.elastic.co/t/increasing-elasticsearch-indexing-rate/74071/13 "2017-02-09T14:31:04Z")
@Christian_Dahlqvist @anhlqn, thanks for your valuable feedback. Following are some more observation. Please let me know your thoughts.
Now I know Logstash is not a bottleneck for now but still Logstash is slow.
I tested my Kafka from the Logstash VM using kafka tools and found that I can read **500,000 events per second from kafka**.
```
$ ./kafka-run-class.sh kafka.tools.ConsumerPerformance --topic mytopic --zookeeper zk1:2181,zk2:2181 --messages 5000000 --threads 1
start.time, end.time, data.consumed.in.MB, MB.sec, data.consumed.in.nMsg, nMsg.sec
2017-02-09 04:49:23:323, 2017-02-09 04:49:32:932, 2227.9454, 231.8603, 5000000, 520345.5094
$ ./kafka-run-class.sh kafka.tools.ConsumerPerformance --topic mytopic --zookeeper zk1:2181,zk2:2181 --messages 5000000 --threads 6
start.time, end.time, data.consumed.in.MB, MB.sec, data.consumed.in.nMsg, nMsg.sec
2017-02-09 04:50:18:417, 2017-02-09 04:51:11:877, 13013.9055, 243.4326, 30000000, 561167.2278
```
Next I ran Logstash with the following config:
```
input {
kafka {
zk_connect=>"kfk1:2181,kfk2:2181,kfk3:2181"
white_list => "topic_name"
group_id => "consumer_group_name
}
}
output {
file {
path => "/dev/null"
}
}
```
I am able to read **140,000 events /second** from Kafka, but when I try to deserialize my incoming AVRO data my read rate drops to **60,000 events/sec**.
```
key_deserializer_class => "org.apache.kafka.common.serialization.ByteArrayDeserializer"
value_deserializer_class => "org.apache.kafka.common.serialization.ByteArrayDeserializer"
codec => avro {
schema_uri => "/apps/schema/rocana3.schema"
}
```
When I try to send this to elasticseach instead of dumping it to `/dev/null`, Logstash is sending only **8,000 to 10,000 events/sec** , so elasticsearch is the bottleneck .

```
I checked the stats of my data node using **iostat** and found that disk was the culprit.
avg-cpu: %user %nice %system %iowait %steal %idle
9.48 0.00 1.76 11.12 0.06 77.58
Device: rrqm/s wrqm/s r/s w/s rkB/s wkB/s avgrq-sz avgqu-sz await r_await w_await svctm %util
xvdc 0.00 37.10 209.67 255.20 1480.68 10406.85 51.14 0.75 1.62 14.69 5.60 0.80 37.35
avg-cpu: %user %nice %system %iowait %steal %idle
19.97 0.00 5.70 46.48 0.17 27.68
Device: rrqm/s wrqm/s r/s w/s rkB/s wkB/s avgrq-sz avgqu-sz await r_await w_await svctm %util
xvdc 0.00 0.00 0.99 1514.85 3.96 66035.64 87.13 179.70 94.48 12.00 94.53 0.65 99.01
avg-cpu: %user %nice %system %iowait %steal %idle
1.34 0.00 9.38 48.58 0.17 40.54
Device: rrqm/s wrqm/s r/s w/s rkB/s wkB/s avgrq-sz avgqu-sz await r_await w_await svctm %util
xvdc 0.00 0.00 0.00 1514.00 0.00 66328.00 87.62 213.09 95.68 0.00 95.68 0.66 100.00
avg-cpu: %user %nice %system %iowait %steal %idle
2.01 0.00 2.84 48.66 0.00 46.49
Device: rrqm/s wrqm/s r/s w/s rkB/s wkB/s avgrq-sz avgqu-sz await r_await w_await svctm %util
xvdc 0.00 77.00 1.00 1381.00 4.00 60308.00 87.28 187.34 208.81 19.00 208.95 0.72 100.00
```
So what I think is happening, ELasticsearch is limited by disk and its asking Logstash to send less data, but what I can't figure out is that no where in the logs this is mentioned that data is being throttled . My both `_index_indexing_slowlog.log and _index_search_slowlog.log` is empty and I don't see anything in my logstash logs. Is there any other place to look for this information?
```
-rw-rw-r-- 1 0 Feb 1 02:54 elk-rtp-test_access.log
-rw-rw-r-- 1 26K Feb 9 06:42 elk-rtp-test_deprecation.log
-rw-rw-r-- 1 0 Feb 1 02:54 elk-rtp-test_index_indexing_slowlog.log
-rw-rw-r-- 1 0 Feb 1 02:54 elk-rtp-test_index_search_slowlog.log
-rw-rw-r-- 1 879 Feb 9 03:03 elk-rtp-test.log
```
---
### Author:  [@Christian\_Dahlqvist](https://discuss.elastic.co/u/Christian_Dahlqvist)
#### Post date: [February 9, 2017, 2:41pm UTC](https://discuss.elastic.co/t/increasing-elasticsearch-indexing-rate/74071/14 "2017-02-09T14:41:35Z")
It is indeed quite clear that your disk is the bottleneck based on those stats. As Elasticsearch during heavy indexing is I/O intensive, I am not surprised by this.
---
### Author:  [@system](https://discuss.elastic.co/u/system)
#### Post date: [March 9, 2017, 3:28pm UTC](https://discuss.elastic.co/t/increasing-elasticsearch-indexing-rate/74071/16 "2017-03-09T15:28:04Z")
This topic was automatically closed 28 days after the last reply. New replies are no longer allowed.