# Indexing performance degradation over time
**URL:** https://discuss.elastic.co/t/indexing-performance-degradation-over-time/107470
**Category:** Elasticsearch
**Created:** [November 13, 2017, 11:21pm UTC](https://discuss.elastic.co/t/indexing-performance-degradation-over-time/107470 "2017-11-13T23:21:39Z")
**Posts on this page:** 20
**Page:** 1
### Author:  [@apyshchyk](https://discuss.elastic.co/u/apyshchyk)
#### Post date: [November 13, 2017, 11:21pm UTC](https://discuss.elastic.co/t/indexing-performance-degradation-over-time/107470/1 "2017-11-13T23:21:39Z")
Hi everyone, I'm using ES 5.5.0 on Amazon EC2 (18 Data nodes 8 CPU, 32GB RAM, 3 master) 1 TB EBS GP2 ssd (3000 IOPS). and have issue with indexing performance (segment merging time).
A bit about workflow - I'm indexing simple json (about 1Kb each), no update, no delete, no parent-child, etc., refresh interval 30 seconds.
indexing into daily indices, which are separated by tenant (has from 2 to 15 shards, depends on planned data amount).
per day, per tenant have ~ 5 Mil events / shard.
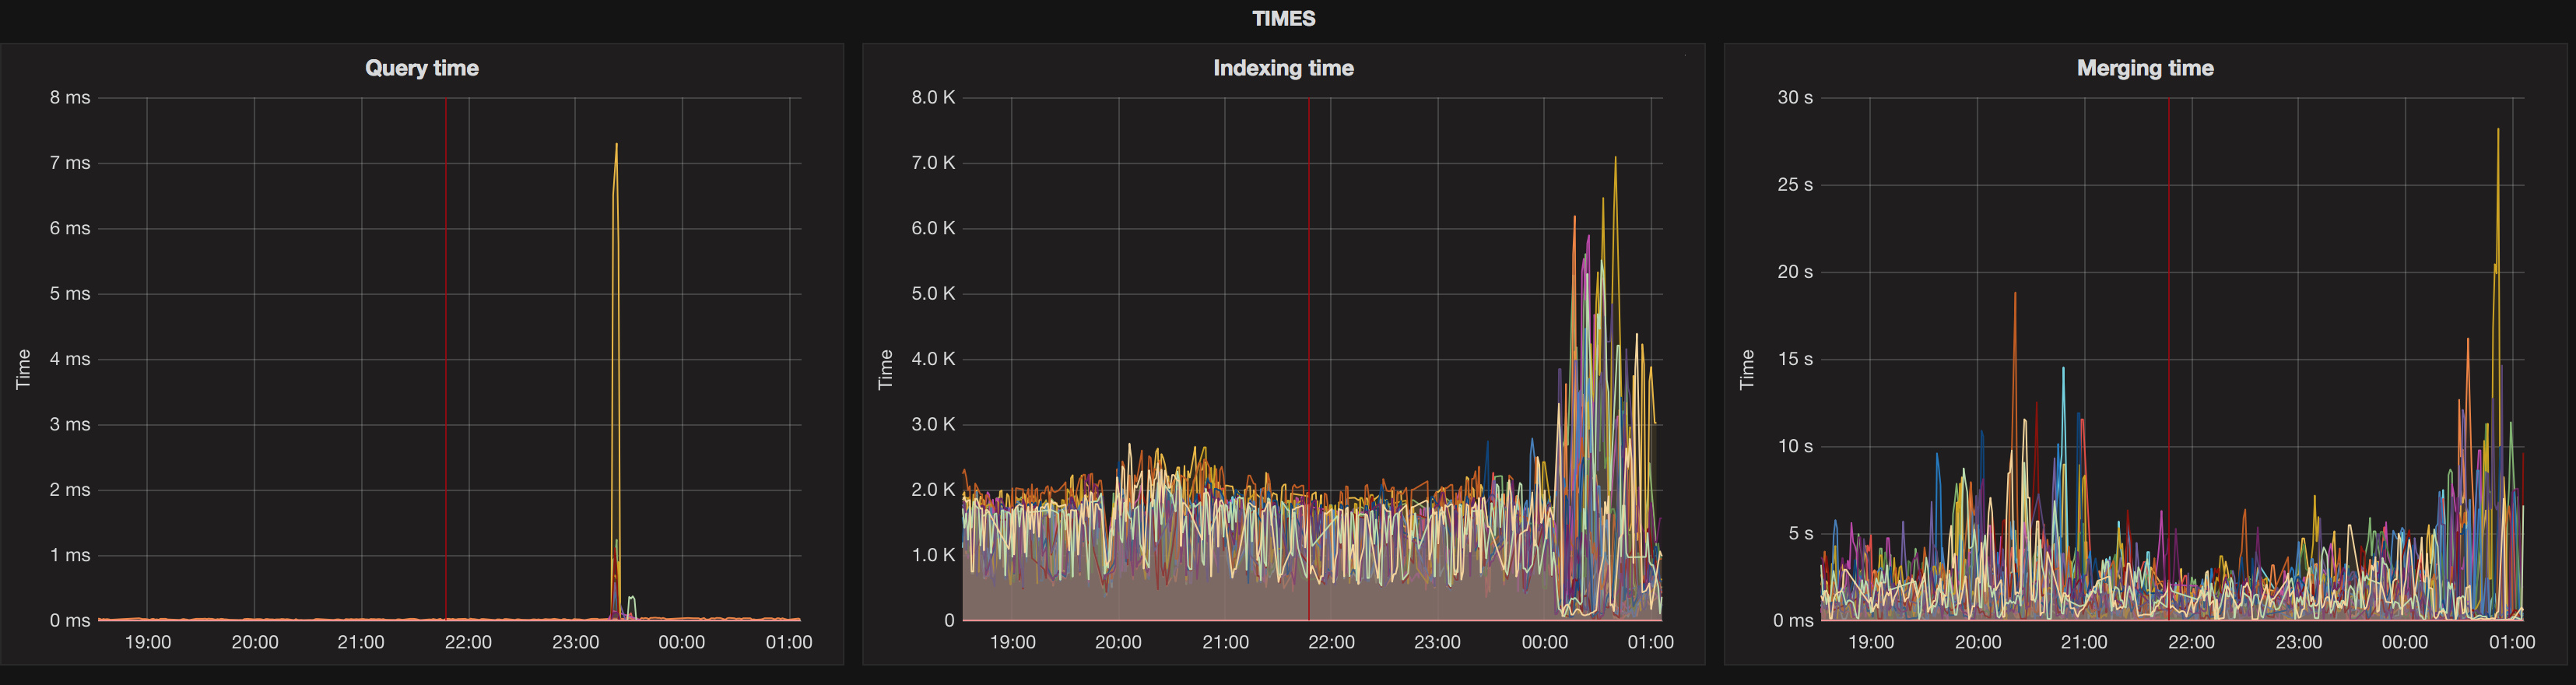
closer to end o each day the is indexing degradation due to segment merging time, it takes a lot.
Currently I'm looking about changing Max size of segment, since 5Gb looks to big for me, and merge segments like 4.8Gb + 100Kb doesn't seem to be fast.
Issue happens when one of data nodes doing merge for 3-9 seconds, and threads a waiting to write data into it.
Or, if you have any other ideas, proposals?
Here is screen from cluster monitoring. Indexing rate currently about 20k events/s, but as you can see - indexing speed far away from 20K, and nodes basically doing nothing. only one or 2 nodes doing some slow merges. These huge spikes in Indexing Time and Merging time - are exactly at the same time when indexing seep lowest

---
### Author:  [@varun\_kumar](https://discuss.elastic.co/u/varun_kumar)
#### Post date: [November 14, 2017, 2:58am UTC](https://discuss.elastic.co/t/indexing-performance-degradation-over-time/107470/2 "2017-11-14T02:58:36Z")
Are there duplicates in your data? i.e. two json with same primary id?
---
### Author:  [@Christian\_Dahlqvist](https://discuss.elastic.co/u/Christian_Dahlqvist)
#### Post date: [November 14, 2017, 6:52am UTC](https://discuss.elastic.co/t/indexing-performance-degradation-over-time/107470/3 "2017-11-14T06:52:17Z")
Can you provide us an overview of the cluster by providing the full output of the [cluster stats API](https://www.elastic.co/guide/en/elasticsearch/reference/current/cluster-stats.html)? What does heap usage and GC look like over time? Is there anything in the logs that indicate why it is slowing down? Are you using daily indices? Do you see any correlation between slowdown and creation of new daily indices?
---
### Author:  [@apyshchyk](https://discuss.elastic.co/u/apyshchyk)
#### Post date: [November 14, 2017, 12:39pm UTC](https://discuss.elastic.co/t/indexing-performance-degradation-over-time/107470/4 "2017-11-14T12:39:37Z")
No duplications, we have our custom ID, owerwriting docs only when app chrashed, and we didn't commit that we have processed bulk to the end.
---
### Author:  [@Christian\_Dahlqvist](https://discuss.elastic.co/u/Christian_Dahlqvist)
#### Post date: [November 14, 2017, 12:46pm UTC](https://discuss.elastic.co/t/indexing-performance-degradation-over-time/107470/5 "2017-11-14T12:46:40Z")
If you are using custom IDs you should read [this blog post](http://blog.mikemccandless.com/2014/05/choosing-fast-unique-identifier-uuid.html). When you use a custom ID Elasticsearch need to check whether the document already exists for every insert, which tend to get slower as shards get larger. If you can use an efficient identifier as described in the blog post, you can reduce this effect, but it will most likely still not be as fast as allowing Elasticsearch to assign IDs automatically.
---
### Author:  [@apyshchyk](https://discuss.elastic.co/u/apyshchyk)
#### Post date: [November 14, 2017, 12:46pm UTC](https://discuss.elastic.co/t/indexing-performance-degradation-over-time/107470/6 "2017-11-14T12:46:51Z")
I'll provide full cluster\_stats output a bit later - right now load is pretty low, so indexing works well
I see correlation between new indices and old one, New process data much faster. About creation of new indices - I precreate indices for next day using separate app. It was hard for ES Cluster to create lots of indices and inserting data at the same time, so I had slow down for 5 - 15 minutes before I went with approach about index precreation.
I checked hot threads, during slow down - there is one- two machines doing merge, and at the same time those machines has 100-200 bulk requests in queue, others doing nothing

---
### Author:  [@apyshchyk](https://discuss.elastic.co/u/apyshchyk)
#### Post date: [November 14, 2017, 12:52pm UTC](https://discuss.elastic.co/t/indexing-performance-degradation-over-time/107470/7 "2017-11-14T12:52:32Z")
Reason why we use our custom ID - to prevent data duplication.
Our workflow - getting data from kafka, push to ES, commit offset to kafka.
If our app crash after pushing to ES and couldn't commit to Kafka, we will reprocess couple thousands messages twice.
---
### Author:  [@apyshchyk](https://discuss.elastic.co/u/apyshchyk)
#### Post date: [November 14, 2017, 12:55pm UTC](https://discuss.elastic.co/t/indexing-performance-degradation-over-time/107470/8 "2017-11-14T12:55:36Z")
{
> Blockquote
> "\_nodes" : {
> "total" : 21,
> "successful" : 21,
> "failed" : 0
> },
> "cluster\_name" : "stage-escluster",
> "timestamp" : 1510664066932,
> "status" : "green",
> "indices" : {
> "count" : 1080,
> "shards" : {
> "total" : 6974,
> "primaries" : 3487,
> "replication" : 1.0,
> "index" : {
> "shards" : {
> "min" : 2,
> "max" : 60,
> "avg" : 6.457407407407407
> },
> "primaries" : {
> "min" : 1,
> "max" : 30,
> "avg" : 3.2287037037037036
> },
> "replication" : {
> "min" : 1.0,
> "max" : 1.0,
> "avg" : 1.0
> }
> }
> },
> "docs" : {
> "count" : 5130705993,
> "deleted" : 1996
> },
> "store" : {
> "size\_in\_bytes" : 14100406765796,
> "throttle\_time\_in\_millis" : 0
> },
> "fielddata" : {
> "memory\_size\_in\_bytes" : 0,
> "evictions" : 0
> },
> "query\_cache" : {
> "memory\_size\_in\_bytes" : 0,
> "total\_count" : 0,
> "hit\_count" : 0,
> "miss\_count" : 0,
> "cache\_size" : 0,
> "cache\_count" : 0,
> "evictions" : 0
> },
> "completion" : {
> "size\_in\_bytes" : 0
> },
> "segments" : {
> "count" : 118255,
> "memory\_in\_bytes" : 26172275408,
> "terms\_memory\_in\_bytes" : 19511538176,
> "stored\_fields\_memory\_in\_bytes" : 4999585136,
> "term\_vectors\_memory\_in\_bytes" : 0,
> "norms\_memory\_in\_bytes" : 15136384,
> "points\_memory\_in\_bytes" : 1058100340,
> "doc\_values\_memory\_in\_bytes" : 587915372,
> "index\_writer\_memory\_in\_bytes" : 7610750628,
> "version\_map\_memory\_in\_bytes" : 85053111,
> "fixed\_bit\_set\_memory\_in\_bytes" : 0,
> "max\_unsafe\_auto\_id\_timestamp" : -1,
> "file\_sizes" : { }
> }
> },
> "nodes" : {
> "count" : {
> "total" : 21,
> "data" : 18,
> "coordinating\_only" : 0,
> "master" : 3,
> "ingest" : 21
> },
> "versions" : [
> "5.5.0"
> ],
> "os" : {
> "available\_processors" : 156,
> "allocated\_processors" : 156,
> "names" : [
> {
> "name" : "Linux",
> "count" : 21
> }
> ],
> "mem" : {
> "total\_in\_bytes" : 648554434560,
> "free\_in\_bytes" : 15388495872,
> "used\_in\_bytes" : 633165938688,
> "free\_percent" : 2,
> "used\_percent" : 98
> }
> },
> "process" : {
> "cpu" : {
> "percent" : 1187
> },
> "open\_file\_descriptors" : {
> "min" : 977,
> "max" : 1745,
> "avg" : 1618
> }
> },
> "jvm" : {
> "max\_uptime\_in\_millis" : 1532237262,
> "versions" : [
> {
> "version" : "1.8.0\_31",
> "vm\_name" : "Java HotSpot(TM) 64-Bit Server VM",
> "vm\_version" : "25.31-b07",
> "vm\_vendor" : "Oracle Corporation",
> "count" : 21
> }
> ],
> "mem" : {
> "heap\_used\_in\_bytes" : 164761887000,
> "heap\_max\_in\_bytes" : 333647708160
> },
> "threads" : 2443
> },
> "fs" : {
> "total\_in\_bytes" : 39368577171456,
> "free\_in\_bytes" : 10708432044032,
> "available\_in\_bytes" : 8729318752256
> },
> "plugins" : [
> {
> "name" : "discovery-ec2",
> "version" : "5.5.0",
> "description" : "The EC2 discovery plugin allows to use AWS API for the unicast discovery mechanism.",
> "classname" : "org.elasticsearch.discovery.ec2.Ec2DiscoveryPlugin",
> "has\_native\_controller" : false
> },
> {
> "name" : "x-pack",
> "version" : "5.5.0",
> "description" : "Elasticsearch Expanded Pack Plugin",
> "classname" : "org.elasticsearch.xpack.XPackPlugin",
> "has\_native\_controller" : true
> }
> ],
> "network\_types" : {
> "transport\_types" : {
> "netty4" : 21
> },
> "http\_types" : {
> "netty4" : 21
> }
> }
> }
> }
---
### Author:  [@Christian\_Dahlqvist](https://discuss.elastic.co/u/Christian_Dahlqvist)
#### Post date: [November 14, 2017, 12:55pm UTC](https://discuss.elastic.co/t/indexing-performance-degradation-over-time/107470/9 "2017-11-14T12:55:51Z")
That is an excellent reason to use custom IDs. You may get improved performance if you can make sure they are efficient though.
---
### Author:  [@apyshchyk](https://discuss.elastic.co/u/apyshchyk)
#### Post date: [November 14, 2017, 12:58pm UTC](https://discuss.elastic.co/t/indexing-performance-degradation-over-time/107470/10 "2017-11-14T12:58:00Z")
Thanks, I'l test today to replace custom id with timestamp + some our fields value
---
### Author:  [@apyshchyk](https://discuss.elastic.co/u/apyshchyk)
#### Post date: [November 14, 2017, 1:05pm UTC](https://discuss.elastic.co/t/indexing-performance-degradation-over-time/107470/11 "2017-11-14T13:05:57Z")
A bit more details about data flow
our app has 10 threads, which are reading from 40 kafka partitions in each bulk from kafka we have data to multiple indices. Example - 1000messages to one, 100 messages to another 30 to third-one, etc. packing it into one bulk request and send to ES.
Mt other thoughts - to send data to ES not in one bulk which contains data about different indices, but to send those bulk one by one - per index.
---
### Author:  [@apyshchyk](https://discuss.elastic.co/u/apyshchyk)
#### Post date: [November 16, 2017, 1:40pm UTC](https://discuss.elastic.co/t/indexing-performance-degradation-over-time/107470/13 "2017-11-16T13:40:44Z")
Problem is still actual, closer to end of the day, when indices become bigger, merge time takes a lot of time and slows down indexing a lot.
---
### Author:  [@Christian\_Dahlqvist](https://discuss.elastic.co/u/Christian_Dahlqvist)
#### Post date: [November 16, 2017, 2:15pm UTC](https://discuss.elastic.co/t/indexing-performance-degradation-over-time/107470/14 "2017-11-16T14:15:58Z")
Is that with a Lucene-friendly document ID? Are you grouping the outputs per index?
---
### Author:  [@apyshchyk](https://discuss.elastic.co/u/apyshchyk)
#### Post date: [November 16, 2017, 2:45pm UTC](https://discuss.elastic.co/t/indexing-performance-degradation-over-time/107470/15 "2017-11-16T14:45:34Z")
I tried to change to ES autogenerated IDs, but behaviour still the same
---
### Author:  [@Christian\_Dahlqvist](https://discuss.elastic.co/u/Christian_Dahlqvist)
#### Post date: [November 17, 2017, 7:26am UTC](https://discuss.elastic.co/t/indexing-performance-degradation-over-time/107470/16 "2017-11-17T07:26:14Z")
If you have not already, it may be worthwhile trying to reduce the number of merging threads to 1 through the [index.merge.scheduler.max\_thread\_count](https://www.elastic.co/guide/en/elasticsearch/reference/5.5/index-modules-merge.html) setting.
---
### Author:  [@antonbormotov](https://discuss.elastic.co/u/antonbormotov)
#### Post date: [November 17, 2017, 5:42pm UTC](https://discuss.elastic.co/t/indexing-performance-degradation-over-time/107470/17 "2017-11-17T17:42:00Z")
Hi Andriy,
It might help to disable refresh interval during ingestion and set replicas to 0.
Of course, in case you don't need to search while importing documents.
Take a look at my post here as well: [Elasticsearch indexing performance: throttle merging](https://discuss.elastic.co/t/elasticsearch-indexing-performance-throttle-merging/71549/8)
---
### Author:  [@apyshchyk](https://discuss.elastic.co/u/apyshchyk)
#### Post date: [November 21, 2017, 1:11pm UTC](https://discuss.elastic.co/t/indexing-performance-degradation-over-time/107470/18 "2017-11-21T13:11:23Z")
HI, thanks for the response, unfortunately I can't do that, since it's streaming data (24/7) and should be available for search in 30 seconds.
---
### Author:  [@Christian\_Dahlqvist](https://discuss.elastic.co/u/Christian_Dahlqvist)
#### Post date: [November 21, 2017, 1:20pm UTC](https://discuss.elastic.co/t/indexing-performance-degradation-over-time/107470/19 "2017-11-21T13:20:28Z")
Even though you can not disable the refresh interval, you may be able to increase it a bit and still meet your SLA. It would be interesting to see what impact this has.
---
### Author:  [@jpountz](https://discuss.elastic.co/u/jpountz)
#### Post date: [November 21, 2017, 1:33pm UTC](https://discuss.elastic.co/t/indexing-performance-degradation-over-time/107470/20 "2017-11-21T13:33:14Z")
For the record, the hot threads pasted above suggest there might be some sparse doc-value fields, which tend to slow down merging and would have the described side-effect of making indexing slower and slower over time (as merges get bigger). Elasticsearch would perform better with fewer denser fields, or if a change of the schema is no option, an upgrade to Elasticsearch 6.0 would help too since 6.0 has much better support for sparse fields.
---
### Author:  [@system](https://discuss.elastic.co/u/system)
#### Post date: [December 19, 2017, 1:33pm UTC](https://discuss.elastic.co/t/indexing-performance-degradation-over-time/107470/21 "2017-12-19T13:33:17Z")
This topic was automatically closed 28 days after the last reply. New replies are no longer allowed.