# Ingestion performance dropping by 10x daily
**URL:** https://discuss.elastic.co/t/ingestion-performance-dropping-by-10x-daily/288537
**Category:** Elasticsearch
**Tags:** docker
**Created:** [November 6, 2021, 5:30am UTC](https://discuss.elastic.co/t/ingestion-performance-dropping-by-10x-daily/288537 "2021-11-06T05:30:00Z")
**Posts on this page:** 5
**Page:** 1
### Author:  [@TanguyB](https://discuss.elastic.co/u/TanguyB)
#### Post date: [November 6, 2021, 5:30am UTC](https://discuss.elastic.co/t/ingestion-performance-dropping-by-10x-daily/288537/1 "2021-11-06T05:30:00Z")
Hello, 👋
We are using Fluentbit to ingest Kubernetes cluster logs into Elasticsearch.
Not sure what I am setting wrong, but every day, as the index grows, ingestion is worsening from 550k op/s to 40k op/s...
Ingestion from fluentbit agent is constant but at some point ES will slow down, starting to queue more and more, using less cpu and rejecting new write

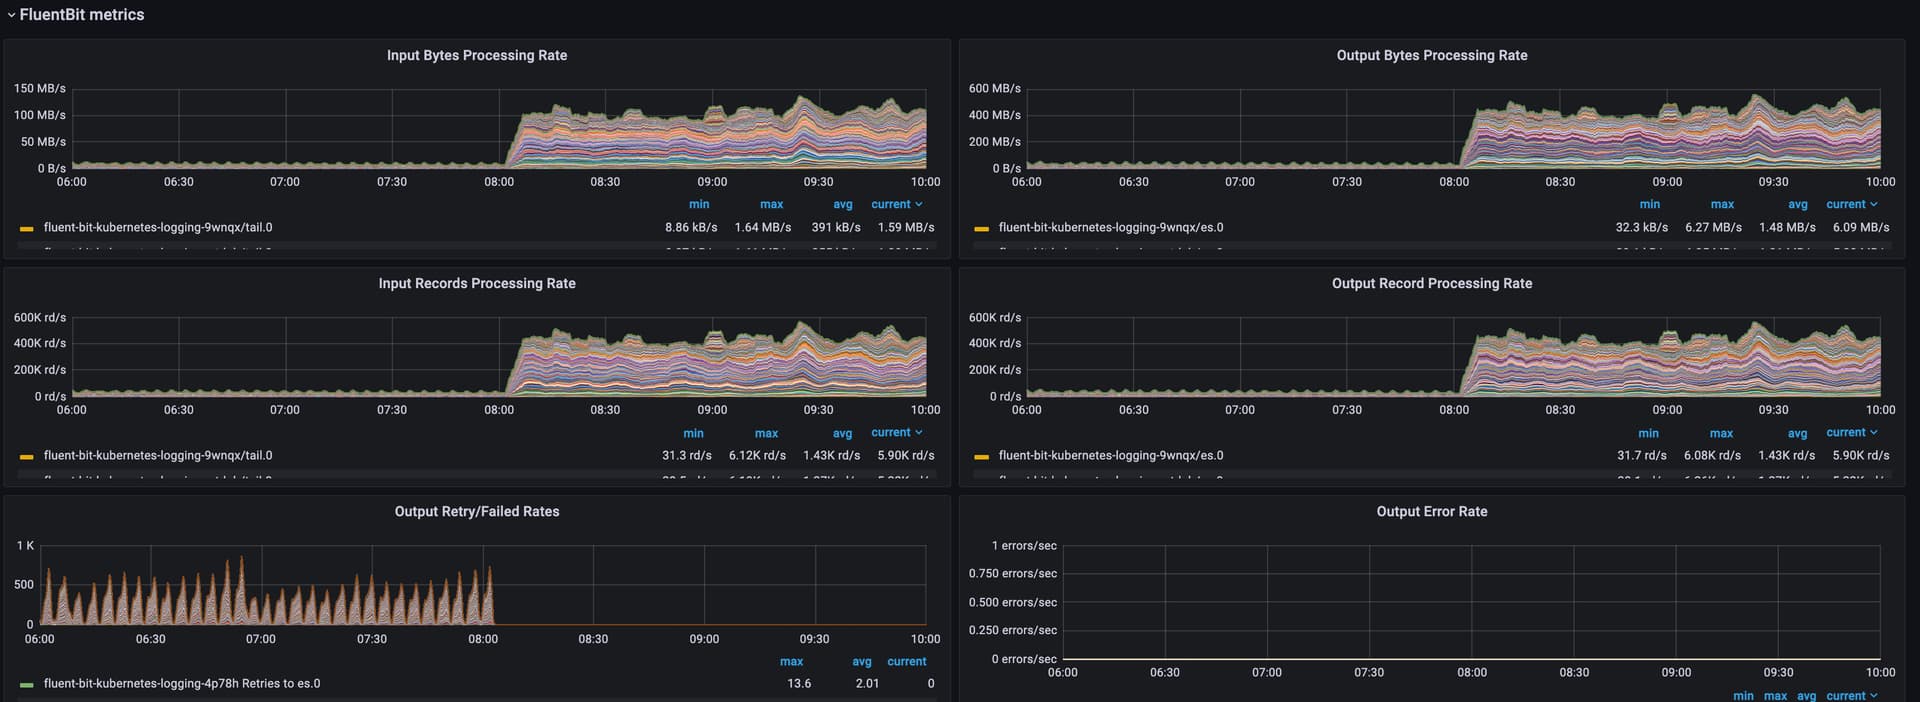
Setup:
Fluentbit 1.8.9
Kube Cluster: 403 nodes
Elastic: 30 datanodes 8C 16G
Our main usage in ingestion, not so much querying, so for the index template I set:
```auto
"refresh_interval": "60s",
"number_of_shards": "30"
"translog": { "durability": "async" },
"number_of_replicas": "0"
```
Today we will try to also add:
`indices.memory.index_buffer_size: 30%`
The index is rolled up daily (fluentbit use the date in the index name it write to), and we move the index to warm phase after 2 days.
FluentBit config:
```auto
[SERVICE]
Flush 1
Daemon Off
Log_Level info
Parsers_File parsers.conf
HTTP_Server On
[INPUT]
Name tail
Path /var/log/containers/*.log
Tag kube.*
Parser docker
DB /var/log/flb_kube.db
Mem_Buf_Limit 512MB
Skip_Long_Lines On
Docker_Mode On
[FILTER]
Name kubernetes
Match kube.*
Kube_URL https://kubernetes.default.svc:443
Kube_CA_File /var/run/secrets/kubernetes.io/serviceaccount/ca.crt
Kube_Token_File /var/run/secrets/kubernetes.io/serviceaccount/token
Kube_Tag_Prefix kube.var.log.containers.
Merge_Log On
Merge_Log_Key json_message
K8S-Logging.Parser On
K8S-Logging.Exclude Off
Annotations Off
[OUTPUT]
Name es
Match kube.*
Host ${ELASTICSEARCH_HOST}
Port ${ELASTICSEARCH_PORT}
Generate_ID On
Logstash_Format On
Replace_Dots On
Logstash_Prefix kube-containers-${CLUSTER_NAME}
Retry_Limit 10
Suppress_Type_Name On
Trace_Error On
Buffer_Size False
```
Any idea ? If I set to create more shards could it bring any benefits ? (should ease queries but just add overheard for ingestion right ?)
Thanks !!
---
### Author:  [@Christian\_Dahlqvist](https://discuss.elastic.co/u/Christian_Dahlqvist)
#### Post date: [November 6, 2021, 6:06am UTC](https://discuss.elastic.co/t/ingestion-performance-dropping-by-10x-daily/288537/2 "2021-11-06T06:06:33Z")
I am not familiar with fluentbit config but it looks like you are having it assign the document ID instead of letting Elasticsearch do this. This will help prevent duplicates but will also make each insert a potential update, which will be flower and slow down as the index grows which seems to match the behaviour you are seeing.
How large does the index get in a day? Which version of Elasticsearch are you using? What type of storage are you using?
---
### Author:  [@TanguyB](https://discuss.elastic.co/u/TanguyB)
#### Post date: [November 6, 2021, 9:51am UTC](https://discuss.elastic.co/t/ingestion-performance-dropping-by-10x-daily/288537/3 "2021-11-06T09:51:51Z")
Thanks for the reply !
I'll disable the 'Generate\_ID' option to check it's probably the cause, as when using fluentd instead of fluentdbit we didn't had those issues
> When enabled, generate `_id` for outgoing records. This prevents duplicate records when retrying ES.
Elasticsearch version: 7.10.2
Storage: SSD, shared storage, not local
Index ~2.6 TB but that's with the big slow down
Without it should reach ~5.5 - 6 TB
---
### Author:  [@TanguyB](https://discuss.elastic.co/u/TanguyB)
#### Post date: [November 6, 2021, 11:19am UTC](https://discuss.elastic.co/t/ingestion-performance-dropping-by-10x-daily/288537/4 "2021-11-06T11:19:46Z")
Elasticsearch restarted with `indices.memory.index_buffer_size: 30%` and Fluentbit Generate\_ID to false.
It seems way better now, previously at 400k op/s cpu used to spike constantly back and forth 65% to 100% (cf 1st screenshot at 16:00).
Now it's 20% - 40%

I'll keep monitoring the evolution thanks again !
---
### Author:  [@system](https://discuss.elastic.co/u/system)
#### Post date: [December 4, 2021, 11:19am UTC](https://discuss.elastic.co/t/ingestion-performance-dropping-by-10x-daily/288537/5 "2021-12-04T11:19:58Z")
This topic was automatically closed 28 days after the last reply. New replies are no longer allowed.