# Kibana Dashboard not showing all data
**URL:** https://discuss.elastic.co/t/kibana-dashboard-not-showing-all-data/151433
**Category:** Kibana
**Created:** [October 8, 2018, 10:41am UTC](https://discuss.elastic.co/t/kibana-dashboard-not-showing-all-data/151433 "2018-10-08T10:41:43Z")
**Posts on this page:** 5
**Page:** 1
### Author:  [@steven97](https://discuss.elastic.co/u/steven97)
#### Post date: [October 8, 2018, 10:41am UTC](https://discuss.elastic.co/t/kibana-dashboard-not-showing-all-data/151433/1 "2018-10-08T10:41:43Z")
I have set up a test environment recently with an Elasticsearch cluster, a Logstash and a Kibana server.
I use it to monitor serveral ESXi hosts, collecting their messages. Everything works fine, I have build up a dashboard, created the visualizations by my own.
My problem I have encountered is that while viewing the dashboard, it doesn't show all data from all hosts.

In this image visible are only 11 hosts and only debug messages. We have added 15 hosts and we are not only receiving debug messages.

Inspecting the visualization there are clearly more hosts than before. There are 14 hosts. (One host is down so it won't log anything)
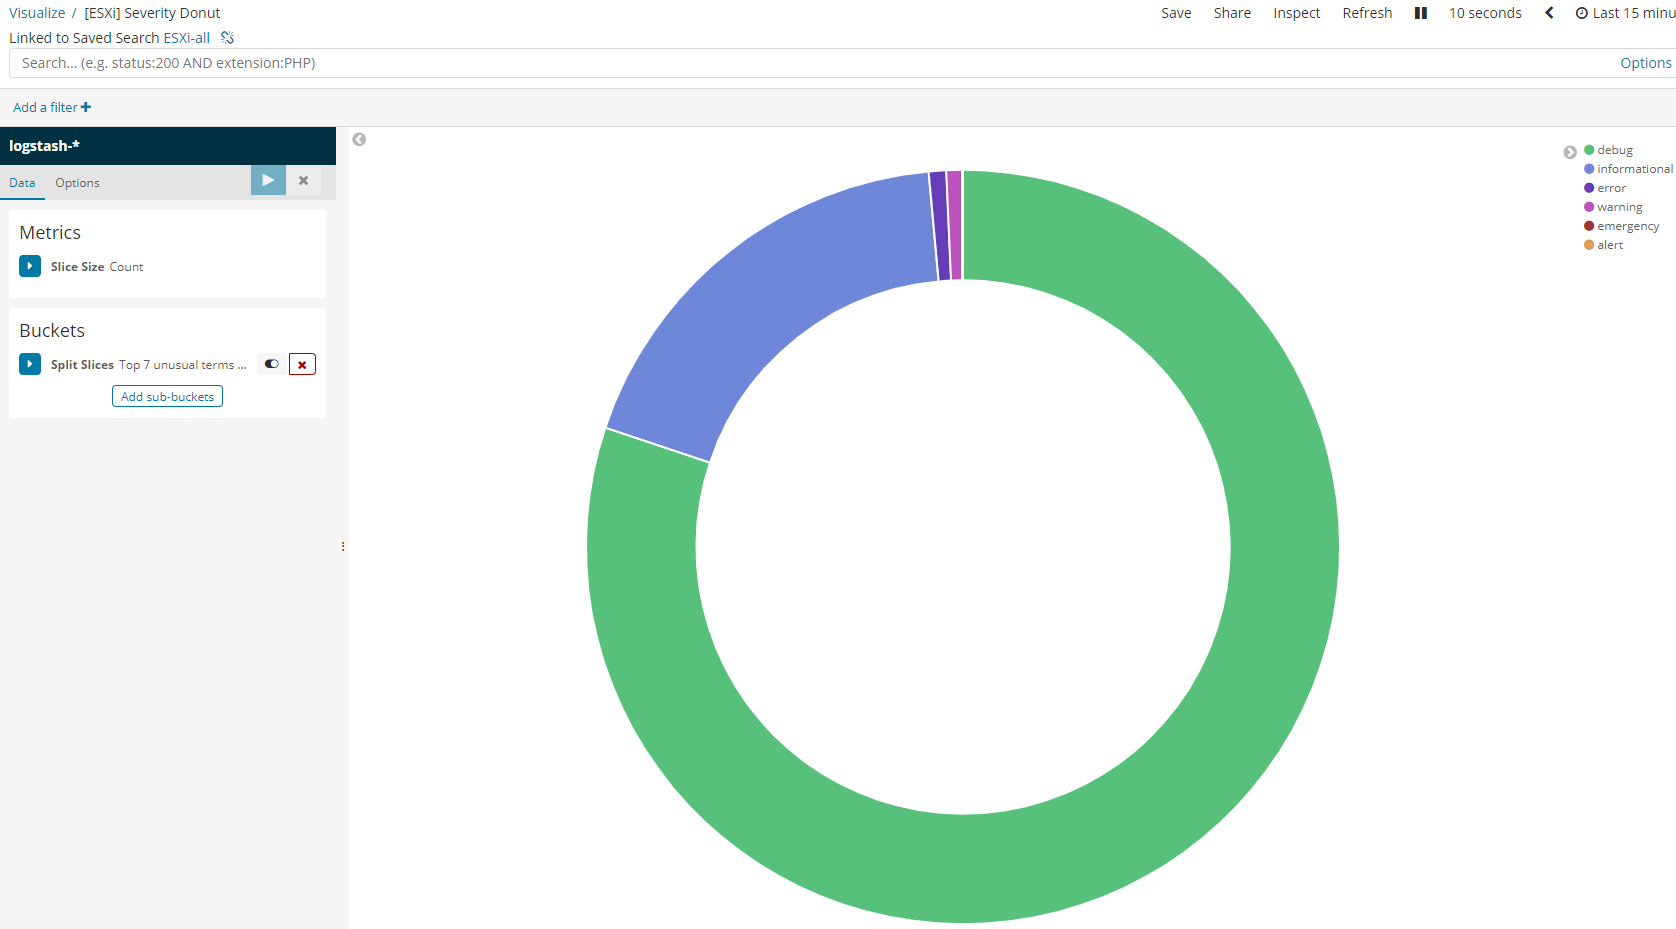
Also there are clearly more than just debug messages.
I have tried to fix it by recreating the diagrams, but nothing worked.
Does anyone know how to fix this?
Thanks
---
### Author:  [@rijinmp](https://discuss.elastic.co/u/rijinmp)
#### Post date: [October 8, 2018, 1:51pm UTC](https://discuss.elastic.co/t/kibana-dashboard-not-showing-all-data/151433/2 "2018-10-08T13:51:27Z")
Try to confirm all hosts logs are present in discover menu.
search your all host names in discover menu consisting search engine .
if any hosts are not present here , that means... that hosts's logs are not shipping to elasticsearch
---
### Author:  [@steven97](https://discuss.elastic.co/u/steven97)
#### Post date: [October 9, 2018, 5:08am UTC](https://discuss.elastic.co/t/kibana-dashboard-not-showing-all-data/151433/3 "2018-10-09T05:08:40Z")
I can confirm that all logs are visible in the Discover Menu. Except the host being down, all hosts have sent logs.

Also when in the dashboard, I can filter to exclude hosts or message types showing the remaining messages, but again not all hosts.
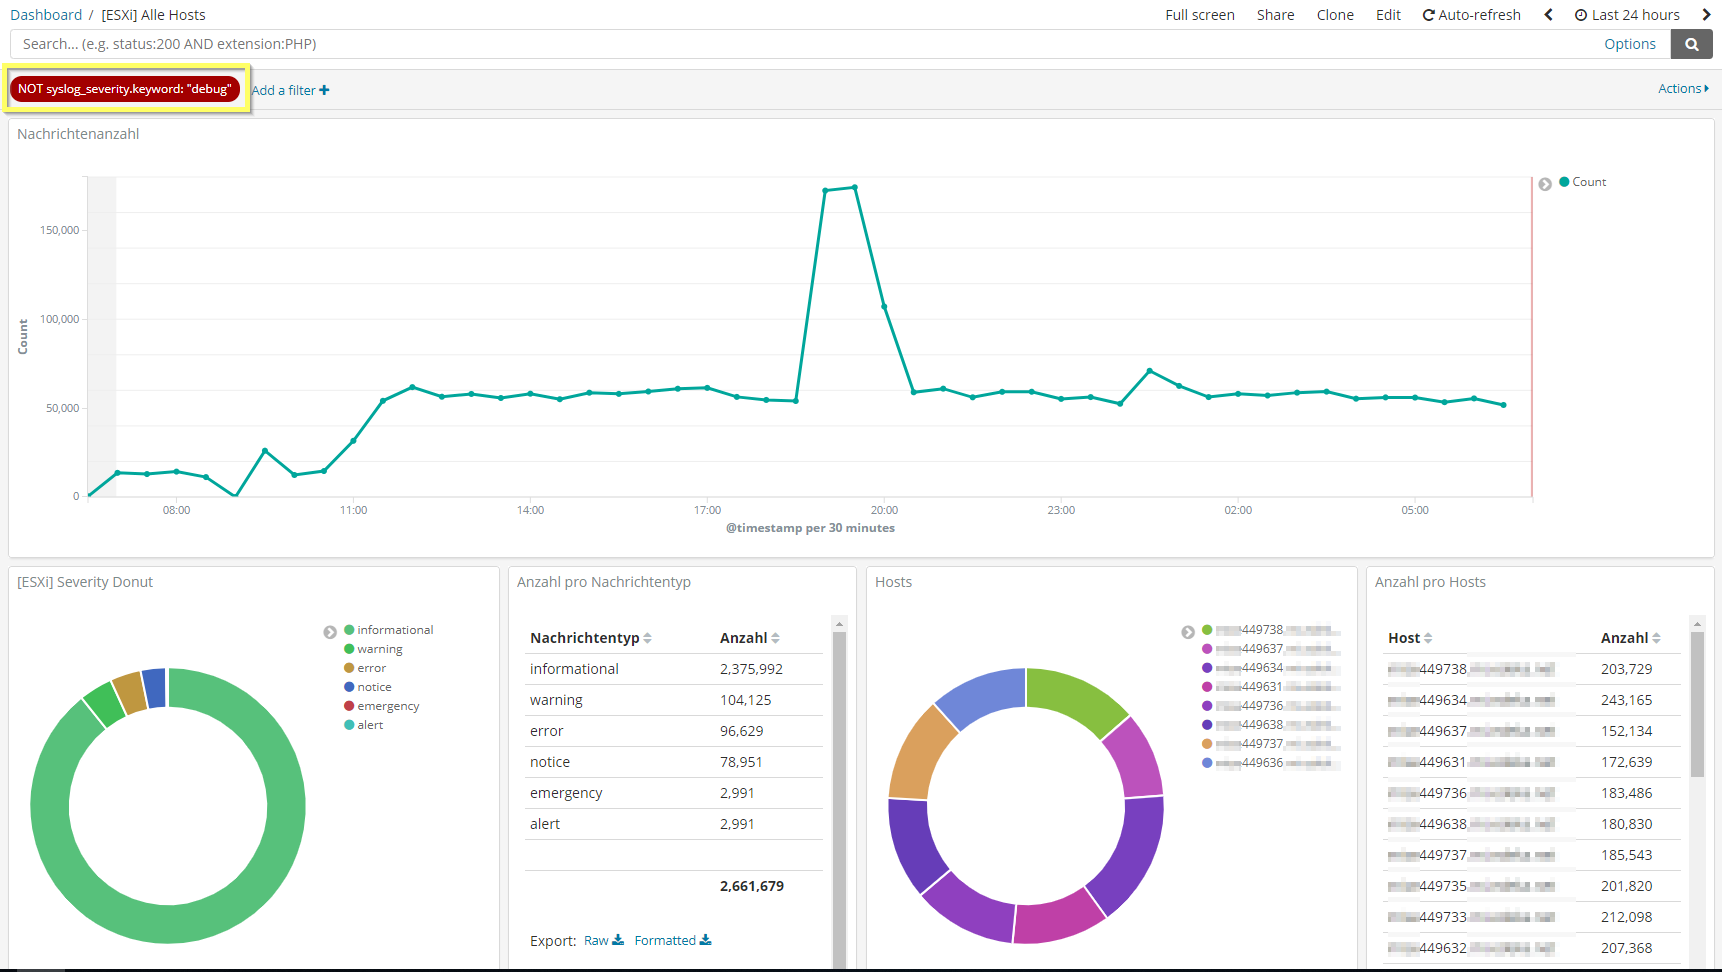
Removing the filter only shows debug messages.
---
### Author:  [@steven97](https://discuss.elastic.co/u/steven97)
#### Post date: [October 9, 2018, 9:55am UTC](https://discuss.elastic.co/t/kibana-dashboard-not-showing-all-data/151433/4 "2018-10-09T09:55:19Z")
I have found the problem: The donut pie charts and the table were split by using "significant terms" instead of "terms" for the aggregation. Having this changed, everything is now shown.
Thanks anyway.
---
### Author:  [@system](https://discuss.elastic.co/u/system)
#### Post date: [November 6, 2018, 9:55am UTC](https://discuss.elastic.co/t/kibana-dashboard-not-showing-all-data/151433/5 "2018-11-06T09:55:21Z")
This topic was automatically closed 28 days after the last reply. New replies are no longer allowed.