# Kibana do not show metrics
**URL:** https://discuss.elastic.co/t/kibana-do-not-show-metrics/149050
**Category:** Kibana
**Created:** [September 19, 2018, 3:20am UTC](https://discuss.elastic.co/t/kibana-do-not-show-metrics/149050 "2018-09-19T03:20:56Z")
**Posts on this page:** 4
**Page:** 1
### Author:  [@Alexey\_Shalin](https://discuss.elastic.co/u/Alexey_Shalin)
#### Post date: [September 19, 2018, 3:20am UTC](https://discuss.elastic.co/t/kibana-do-not-show-metrics/149050/1 "2018-09-19T03:20:57Z")
Hello
I just installed ELK + MetricBeat 6.4. I has issue with modules (resolved). So datas comming from metricbeat -
> 2018-09-19T09:18:24.301+0600 INFO [monitoring] log/log.go:141 Non-zero metrics in the last 30s {"monitoring": {"metrics": {"beat":{"cpu":{"system":{"ticks":828330,"time":{"ms":434}},"total":{"ticks":1706930,"time":{"ms":883},"value":1706930},"user":{"ticks":878600,"time":{"ms":449}}},"info":{"ephemeral\_id":"4eabcc9a-0e85-46ab-a506-37bfdd108e34","uptime":{"ms":62670061}},"memstats":{"gc\_next":7220400,"memory\_alloc":4920424,"memory\_total":120150206440}},"libbeat":{"config":{"module":{"running":0}},"output":{"events":{"acked":66,"batches":3,"total":66},"read":{"bytes":15276},"write":{"bytes":39146}},"pipeline":{"clients":6,"events":{"active":0,"published":66,"total":66},"queue":{"acked":66}}},"metricbeat":{"system":{"core":{"events":12,"success":12},"cpu":{"events":3,"success":3},"filesystem":{"events":7,"success":7},"fsstat":{"events":1,"success":1},"load":{"events":3,"success":3},"memory":{"events":3,"success":3},"network":{"events":9,"success":9},"process":{"events":25,"success":25},"process\_summary":{"events":3,"success":3}}},"system":{"load":{"1":2.91,"15":2.43,"5":2.68,"norm":{"1":0.7275,"15":0.6075,"5":0.67}}}}}}
All looks good, but in kibana i see this:
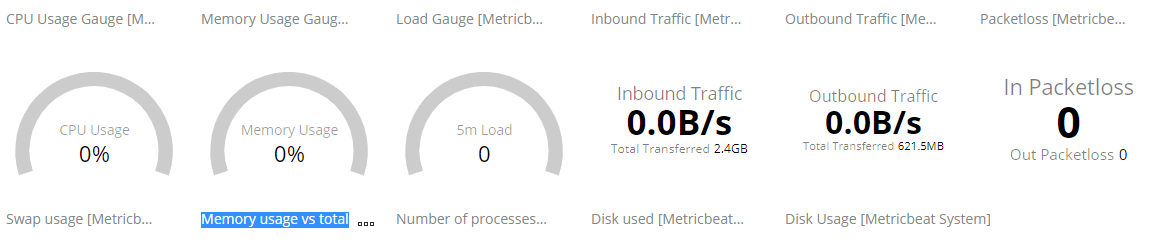
how to resolve it ?
---
### Author:  [@lukas](https://discuss.elastic.co/u/lukas)
#### Post date: [September 19, 2018, 3:16pm UTC](https://discuss.elastic.co/t/kibana-do-not-show-metrics/149050/2 "2018-09-19T15:16:13Z")
Time series visual builder shows only the last bucket, so if you have no results for only the last bucket in your data, you'll see zeros. Is that the case here?
---
### Author:  [@Alexey\_Shalin](https://discuss.elastic.co/u/Alexey_Shalin)
#### Post date: [September 21, 2018, 7:45am UTC](https://discuss.elastic.co/t/kibana-do-not-show-metrics/149050/3 "2018-09-21T07:45:42Z")
Hello
But i see that data comming from servers ☹
i just want to see some datas ☹ i see it only graph
---
### Author:  [@system](https://discuss.elastic.co/u/system)
#### Post date: [October 19, 2018, 7:45am UTC](https://discuss.elastic.co/t/kibana-do-not-show-metrics/149050/4 "2018-10-19T07:45:58Z")
This topic was automatically closed 28 days after the last reply. New replies are no longer allowed.