# Kibana Visualisation Average Monthly Sums Over Years
**URL:** https://discuss.elastic.co/t/kibana-visualisation-average-monthly-sums-over-years/146935
**Category:** Kibana
**Created:** [September 1, 2018, 8:28am UTC](https://discuss.elastic.co/t/kibana-visualisation-average-monthly-sums-over-years/146935 "2018-09-01T08:28:58Z")
**Posts on this page:** 6
**Page:** 1
### Author:  [@Tanatos\_Daniel](https://discuss.elastic.co/u/Tanatos_Daniel)
#### Post date: [September 1, 2018, 8:28am UTC](https://discuss.elastic.co/t/kibana-visualisation-average-monthly-sums-over-years/146935/1 "2018-09-01T08:28:58Z")
I have these daily records.. for a period of 7 years. I managed to calculate the sum for each month and get a chart like this

I also managed to plot the sum on each month over the years.
So the first point in this second chart represents something like this:
`Sum of Daily Recods in Jan 2010+Sum of Daily Records in Jan 2011+..+Sum of Daily Records in Jan2016`

And is correct since I checked it using Excel. But now I would like to average the total on each month over the 7 years. And this goes very wrong because when I select Average aggregation on Y-axis, the average is calculated as the sum of the daily values and split to the number of days in each month. And I need this sum divided by the number of years.. Can this be done?
This second chart would look exactly the same for the average of months over the years, except the Y-axis would have a Scale divided by 7.
Or.. is it possible to create new montly records based on the sums obtained in the previous charts?
---
### Author:  [@Tanatos\_Daniel](https://discuss.elastic.co/u/Tanatos_Daniel)
#### Post date: [September 1, 2018, 9:32pm UTC](https://discuss.elastic.co/t/kibana-visualisation-average-monthly-sums-over-years/146935/2 "2018-09-01T21:32:49Z")
I spent the whole day getting the right DSL query. But I was barking at the wrong tree. The solution is actually very short. It may not be dynamical, or at least I haven't found it yet, but here it is:

Hope it would help others.
---
### Author:  [@Brandon\_Kobel](https://discuss.elastic.co/u/Brandon_Kobel)
#### Post date: [September 4, 2018, 11:21am UTC](https://discuss.elastic.co/t/kibana-visualisation-average-monthly-sums-over-years/146935/3 "2018-09-04T11:21:33Z")
Hey @Tanatos_Daniel, from my understanding, you already have the month and the year of the dates extracted into separate fields which makes the type of analysis that you're looking to do much easier.
To calculate the averages per year over the months, I'd recommend a line chart configuration similar to the following:

And then if you wish to calculate the average per month total, you can use something similar to:
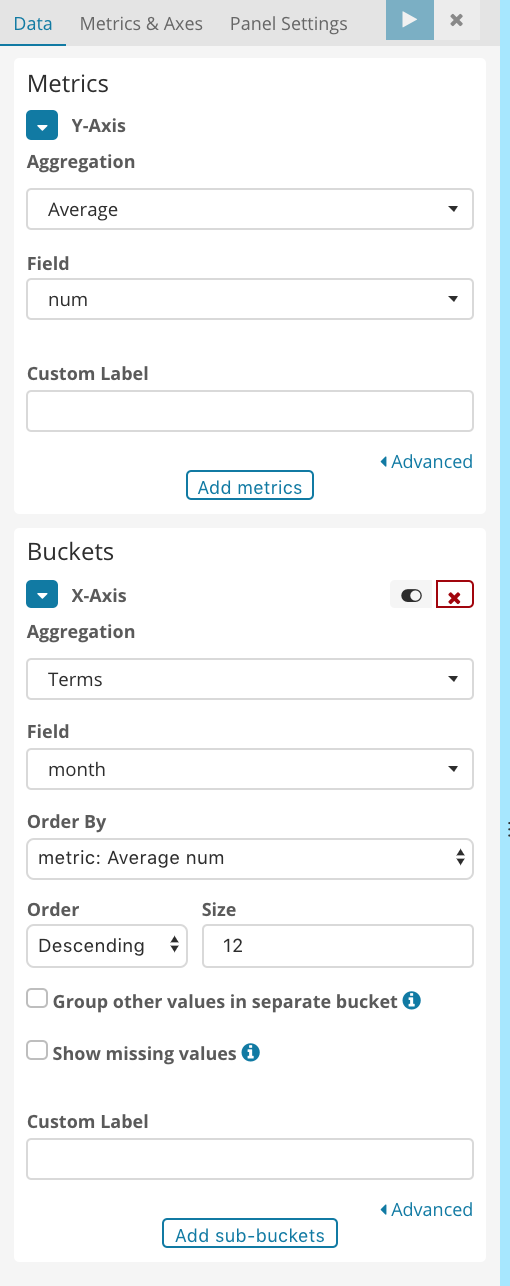
---
### Author:  [@Tanatos\_Daniel](https://discuss.elastic.co/u/Tanatos_Daniel)
#### Post date: [September 4, 2018, 3:20pm UTC](https://discuss.elastic.co/t/kibana-visualisation-average-monthly-sums-over-years/146935/4 "2018-09-04T15:20:19Z")
This is awesome. Really appreciate your answer.
But there's one more thing I needed.. The descending/ascending options.. with the options you've shown me, the plot is drawn based on the descending/ascending order of the average monthly values.. and I needed them to be cronological. So I just changed the `Order by` to `Term` and then chose `Ascending`.
---
### Author:  [@Tanatos\_Daniel](https://discuss.elastic.co/u/Tanatos_Daniel)
#### Post date: [September 4, 2018, 4:09pm UTC](https://discuss.elastic.co/t/kibana-visualisation-average-monthly-sums-over-years/146935/5 "2018-09-04T16:09:47Z")
Sorry, @[Brandon\_Kobel](https://discuss.elastic.co/u/Brandon_Kobel)
Might not be over yet.. I use your filter and I get this chart

and when I use the visualization where I used the script to get the montly average for every year I get this one

They are identical, but their Y-axis differ.. I get the exact same values as with your filter if I do the average on that month.. split by the number of days. But that's not I want.
I want to sum up the values in each month over the seven years and the average over the seven years, not on the number of days each month has:
`Sum of Daily Recods in Jan 2010+Sum of Daily Records in Jan 2011+..+Sum of Daily Records in Jan2016/7`
Am I making any sense?
---
### Author:  [@system](https://discuss.elastic.co/u/system)
#### Post date: [October 2, 2018, 4:09pm UTC](https://discuss.elastic.co/t/kibana-visualisation-average-monthly-sums-over-years/146935/6 "2018-10-02T16:09:49Z")
This topic was automatically closed 28 days after the last reply. New replies are no longer allowed.