# Logstach is broken when using syslog pipeline

**URL:** https://discuss.elastic.co/t/logstach-is-broken-when-using-syslog-pipeline/304584
**Category:** Logstash
**Created:** [May 12, 2022, 2:21pm UTC](https://discuss.elastic.co/t/logstach-is-broken-when-using-syslog-pipeline/304584 "2022-05-12T14:21:42Z")
**Posts on this page:** 7
**Page:** 1

<div class="post-metadata">

### Author: ![sbocquet](https://sea2.discourse-cdn.com/elastic/user_avatar/discuss.elastic.co/sbocquet/32/105594_2.png) [@sbocquet](https://discuss.elastic.co/u/sbocquet)
#### Post date: [May 12, 2022, 2:21pm UTC](https://discuss.elastic.co/t/logstach-is-broken-when-using-syslog-pipeline/304584/1 "2022-05-12T14:21:42Z")

</div>

Hi,

I've just installed a brand new ElacticSearch v8.2 with Logstach. Both a talking well together. Kibana is installed too. Background server are Debian 11 up to date.

I try to send all the logs I collect with a syslog-ng on another server to the logstach one. Even if the configuration test runs fine, logstach doesn't want to run.

Here is my syslog conf file:

```auto
root@elasticvprd1:/etc/logstash/conf.d# cat 01-syslog-input.conf
input {
  tcp {
    port =514
    type =syslog
  }
}

output {
  elasticsearch {
    hosts =["https://localhost:9200"]
    ssl =true
    cacert ="/etc/logstash/certs/http_ca.crt"
    user =logstach_internal
    password =logstach_internal
    index ="syslogs-%{+YYYY.MM}"
  }
}

```

Validation is OK:

```auto
root@elasticvprd1:/etc/logstash/conf.d# sudo -u logstash /usr/share/logstash/bin/logstash --path.settings /etc/logstash -t
Using bundled JDK: /usr/share/logstash/jdk
Sending Logstash logs to /var/log/logstash which is now configured via log4j2.properties
[2022-05-12T15:59:27,460][INFO][logstash.runner] Log4j configuration path used is: /etc/logstash/log4j2.properties
[2022-05-12T15:59:27,468][INFO][logstash.runner] Starting Logstash {"logstash.version"=>"8.2.0", "jruby.version"=>"jruby 9.2.20.1 (2.5.8) 2021-11-30 2a2962fbd1 OpenJDK 64-Bit Server VM 11.0.14.1+1 on 11.0.14.1+1 +indy +jit [linux-x86_64]"}
[2022-05-12T15:59:27,470][INFO][logstash.runner] JVM bootstrap flags: [-Xms1g, -Xmx1g, -Djava.awt.headless=true, -Dfile.encoding=UTF-8, -Djruby.compile.invokedynamic=true, -Djruby.jit.threshold=0, -Djruby.regexp.interruptible=true, -XX:+HeapDumpOnOutOfMemoryError, -Djava.security.egd=file:/dev/urandom, -Dlog4j2.isThreadContextMapInheritable=true, --add-opens=java.base/java.security=ALL-UNNAMED, --add-opens=java.base/java.io=ALL-UNNAMED, --add-opens=java.base/java.nio.channels=ALL-UNNAMED, --add-opens=java.base/sun.nio.ch=ALL-UNNAMED, --add-opens=java.management/sun.management=ALL-UNNAMED]
[2022-05-12T15:59:28,167][INFO][org.reflections.Reflections] Reflections took 81 ms to scan 1 urls, producing 120 keys and 419 values
[2022-05-12T15:59:28,608][INFO][logstash.javapipeline] Pipeline `main` is configured with `pipeline.ecs_compatibility: v8` setting. All plugins in this pipeline will default to `ecs_compatibility =v8` unless explicitly configured otherwise.
Configuration OK
[2022-05-12T15:59:28,609][INFO][logstash.runner] Using config.test_and_exit mode. Config Validation Result: OK. Exiting Logstash

```

Unfortunatly...

```auto
root@elasticvprd1:/etc/logstash/conf.d# sudo -u logstash /usr/share/logstash/bin/logstash --path.settings /etc/logstash
Using bundled JDK: /usr/share/logstash/jdk
Sending Logstash logs to /var/log/logstash which is now configured via log4j2.properties
[2022-05-12T16:06:12,486][INFO][logstash.runner] Log4j configuration path used is: /etc/logstash/log4j2.properties
[2022-05-12T16:06:12,492][INFO][logstash.runner] Starting Logstash {"logstash.version"=>"8.2.0", "jruby.version"=>"jruby 9.2.20.1 (2.5.8) 2021-11-30 2a2962fbd1 OpenJDK 64-Bit Server VM 11.0.14.1+1 on 11.0.14.1+1 +indy +jit [linux-x86_64]"}
[2022-05-12T16:06:12,493][INFO][logstash.runner] JVM bootstrap flags: [-Xms1g, -Xmx1g, -Djava.awt.headless=true, -Dfile.encoding=UTF-8, -Djruby.compile.invokedynamic=true, -Djruby.jit.threshold=0, -Djruby.regexp.interruptible=true, -XX:+HeapDumpOnOutOfMemoryError, -Djava.security.egd=file:/dev/urandom, -Dlog4j2.isThreadContextMapInheritable=true, --add-opens=java.base/java.security=ALL-UNNAMED, --add-opens=java.base/java.io=ALL-UNNAMED, --add-opens=java.base/java.nio.channels=ALL-UNNAMED, --add-opens=java.base/sun.nio.ch=ALL-UNNAMED, --add-opens=java.management/sun.management=ALL-UNNAMED]
TimerTask timeouts are now ignored as these were not able to be implemented correctly
[2022-05-12T16:06:13,627][INFO][logstash.agent] Successfully started Logstash API endpoint {:port=>9600, :ssl_enabled=>false}
[2022-05-12T16:06:14,188][INFO][org.reflections.Reflections] Reflections took 77 ms to scan 1 urls, producing 120 keys and 419 values
[2022-05-12T16:06:14,665][INFO][logstash.javapipeline] Pipeline `main` is configured with `pipeline.ecs_compatibility: v8` setting. All plugins in this pipeline will default to `ecs_compatibility =v8` unless explicitly configured otherwise.
[2022-05-12T16:06:14,720][INFO][logstash.outputs.elasticsearch][main] New Elasticsearch output {:class=>"LogStash::Outputs::ElasticSearch", :hosts=>["https://localhost:9200"]}
[2022-05-12T16:06:15,017][INFO][logstash.outputs.elasticsearch][main] Elasticsearch pool URLs updated {:changes=>{:removed=>[], :added=>[https://logstach_internal:xxxxxx@localhost:9200/]}}
[2022-05-12T16:06:15,470][WARN][logstash.outputs.elasticsearch][main] Restored connection to ES instance {:url=>"https://logstach_internal:xxxxxx@localhost:9200/"}
[2022-05-12T16:06:15,485][INFO][logstash.outputs.elasticsearch][main] Elasticsearch version determined (8.2.0) {:es_version=>8}
[2022-05-12T16:06:15,487][WARN][logstash.outputs.elasticsearch][main] Detected a 6.x and above cluster: the `type` event field won't be used to determine the document _type {:es_version=>8}
[2022-05-12T16:06:15,563][INFO][logstash.outputs.elasticsearch][main] Config is not compliant with data streams. `data_stream =auto` resolved to `false`
[2022-05-12T16:06:15,565][WARN][logstash.outputs.elasticsearch][main] Elasticsearch Output configured with `ecs_compatibility =v8`, which resolved to an UNRELEASED preview of version 8.0.0 of the Elastic Common Schema. Once ECS v8 and an updated release of this plugin are publicly available, you will need to update this plugin to resolve this warning.
[2022-05-12T16:06:15,570][INFO][logstash.outputs.elasticsearch][main] Config is not compliant with data streams. `data_stream =auto` resolved to `false`
[2022-05-12T16:06:15,639][INFO][logstash.outputs.elasticsearch][main] Using a default mapping template {:es_version=>8, :ecs_compatibility=>:v8}
[2022-05-12T16:06:15,716][INFO][logstash.javapipeline][main] Starting pipeline {:pipeline_id=>"main", "pipeline.workers"=>4, "pipeline.batch.size"=>125, "pipeline.batch.delay"=>50, "pipeline.max_inflight"=>500, "pipeline.sources"=>["/etc/logstash/conf.d/01-syslog-input.conf"], :thread=>"#<Thread:0xad6b120 run>"}
[2022-05-12T16:06:16,541][INFO][logstash.javapipeline][main] Pipeline Java execution initialization time {"seconds"=>0.82}
[2022-05-12T16:06:16,720][INFO][logstash.javapipeline][main] Pipeline started {"pipeline.id"=>"main"}
[2022-05-12T16:06:16,734][INFO][logstash.inputs.tcp][main][4b9177771b9983d9f2ba83903e1406450d6f39c27a9e0e26d295e32f61d83781] Starting tcp input listener {:address=>"0.0.0.0:514", :ssl_enable=>false}
[2022-05-12T16:06:16,768][INFO][logstash.agent] Pipelines running {:count=>1, :running_pipelines=>[:main], :non_running_pipelines=>[]}
[2022-05-12T16:06:16,833][ERROR][logstash.javapipeline][main][4b9177771b9983d9f2ba83903e1406450d6f39c27a9e0e26d295e32f61d83781] A plugin had an unrecoverable error. Will restart this plugin.
  Pipeline_id:main
  Plugin: <LogStash::Inputs::Tcp type=>"syslog", port=>514, id=>"4b9177771b9983d9f2ba83903e1406450d6f39c27a9e0e26d295e32f61d83781", enable_metric=>true, codec=><LogStash::Codecs::Line id=>"line_13d3678c-666b-4cab-bde3-efd391348ba7", enable_metric=>true, charset=>"UTF-8", delimiter=>"\n">, host=>"0.0.0.0", mode=>"server", proxy_protocol=>false, ssl_enable=>false, ssl_verify=>true, ssl_key_passphrase=><password>, tcp_keep_alive=>false, dns_reverse_lookup_enabled=>true>
  Error: Permission denied
  Exception: Java::JavaNet::SocketException
  Stack: sun.nio.ch.Net.bind0(Native Method)
sun.nio.ch.Net.bind(sun/nio/ch/Net.java:459)
sun.nio.ch.Net.bind(sun/nio/ch/Net.java:448)
sun.nio.ch.ServerSocketChannelImpl.bind(sun/nio/ch/ServerSocketChannelImpl.java:227)
io.netty.channel.socket.nio.NioServerSocketChannel.doBind(io/netty/channel/socket/nio/NioServerSocketChannel.java:134)
io.netty.channel.AbstractChannel$AbstractUnsafe.bind(io/netty/channel/AbstractChannel.java:562)
io.netty.channel.DefaultChannelPipeline$HeadContext.bind(io/netty/channel/DefaultChannelPipeline.java:1334)
io.netty.channel.AbstractChannelHandlerContext.invokeBind(io/netty/channel/AbstractChannelHandlerContext.java:506)
io.netty.channel.AbstractChannelHandlerContext.bind(io/netty/channel/AbstractChannelHandlerContext.java:491)
io.netty.channel.DefaultChannelPipeline.bind(io/netty/channel/DefaultChannelPipeline.java:973)
io.netty.channel.AbstractChannel.bind(io/netty/channel/AbstractChannel.java:260)
io.netty.bootstrap.AbstractBootstrap$2.run(io/netty/bootstrap/AbstractBootstrap.java:356)
io.netty.util.concurrent.AbstractEventExecutor.safeExecute(io/netty/util/concurrent/AbstractEventExecutor.java:164)
io.netty.util.concurrent.SingleThreadEventExecutor.runAllTasks(io/netty/util/concurrent/SingleThreadEventExecutor.java:472)
io.netty.channel.nio.NioEventLoop.run(io/netty/channel/nio/NioEventLoop.java:500)
io.netty.util.concurrent.SingleThreadEventExecutor$4.run(io/netty/util/concurrent/SingleThreadEventExecutor.java:989)
io.netty.util.internal.ThreadExecutorMap$2.run(io/netty/util/internal/ThreadExecutorMap.java:74)
io.netty.util.concurrent.FastThreadLocalRunnable.run(io/netty/util/concurrent/FastThreadLocalRunnable.java:30)
java.lang.Thread.run(java/lang/Thread.java:829)
[2022-05-12T16:06:20,855][INFO][logstash.inputs.tcp][main][4b9177771b9983d9f2ba83903e1406450d6f39c27a9e0e26d295e32f61d83781] Starting tcp input listener {:address=>"0.0.0.0:514", :ssl_enable=>false}
[2022-05-12T16:06:20,866][WARN][io.netty.channel.AbstractChannel][main][4b9177771b9983d9f2ba83903e1406450d6f39c27a9e0e26d295e32f61d83781] Force-closing a channel whose registration task was not accepted by an event loop: [id: 0x243092bd]
java.util.concurrent.RejectedExecutionException: event executor terminated
        at io.netty.util.concurrent.SingleThreadEventExecutor.reject(SingleThreadEventExecutor.java:926) ~[netty-all-4.1.65.Final.jar:4.1.65.Final]
        at io.netty.util.concurrent.SingleThreadEventExecutor.offerTask(SingleThreadEventExecutor.java:353) ~[netty-all-4.1.65.Final.jar:4.1.65.Final]
        at io.netty.util.concurrent.SingleThreadEventExecutor.addTask(SingleThreadEventExecutor.java:346) ~[netty-all-4.1.65.Final.jar:4.1.65.Final]
        at io.netty.util.concurrent.SingleThreadEventExecutor.execute(SingleThreadEventExecutor.java:828) ~[netty-all-4.1.65.Final.jar:4.1.65.Final]
        at io.netty.util.concurrent.SingleThreadEventExecutor.execute(SingleThreadEventExecutor.java:818) ~[netty-all-4.1.65.Final.jar:4.1.65.Final]
        at io.netty.channel.AbstractChannel$AbstractUnsafe.register(AbstractChannel.java:483) [netty-all-4.1.65.Final.jar:4.1.65.Final]
        at io.netty.channel.SingleThreadEventLoop.register(SingleThreadEventLoop.java:87) [netty-all-4.1.65.Final.jar:4.1.65.Final]
        at io.netty.channel.SingleThreadEventLoop.register(SingleThreadEventLoop.java:81) [netty-all-4.1.65.Final.jar:4.1.65.Final]
        at io.netty.channel.MultithreadEventLoopGroup.register(MultithreadEventLoopGroup.java:86) [netty-all-4.1.65.Final.jar:4.1.65.Final]
        at io.netty.bootstrap.AbstractBootstrap.initAndRegister(AbstractBootstrap.java:323) [netty-all-4.1.65.Final.jar:4.1.65.Final]
        at io.netty.bootstrap.AbstractBootstrap.doBind(AbstractBootstrap.java:272) [netty-all-4.1.65.Final.jar:4.1.65.Final]
        at io.netty.bootstrap.AbstractBootstrap.bind(AbstractBootstrap.java:268) [netty-all-4.1.65.Final.jar:4.1.65.Final]
        at io.netty.bootstrap.AbstractBootstrap.bind(AbstractBootstrap.java:253) [netty-all-4.1.65.Final.jar:4.1.65.Final]
        at org.logstash.tcp.InputLoop.run(InputLoop.java:86) [logstash-input-tcp-6.2.7.jar:?]
        at jdk.internal.reflect.NativeMethodAccessorImpl.invoke0(Native Method) ~[?:?]
        at jdk.internal.reflect.NativeMethodAccessorImpl.invoke(NativeMethodAccessorImpl.java:62) ~[?:?]
        at jdk.internal.reflect.DelegatingMethodAccessorImpl.invoke(DelegatingMethodAccessorImpl.java:43) ~[?:?]
        at java.lang.reflect.Method.invoke(Method.java:566) ~[?:?]
        at org.jruby.javasupport.JavaMethod.invokeDirectWithExceptionHandling(JavaMethod.java:441) [jruby.jar:?]
        at org.jruby.javasupport.JavaMethod.invokeDirect(JavaMethod.java:305) [jruby.jar:?]
        at org.jruby.java.invokers.InstanceMethodInvoker.call(InstanceMethodInvoker.java:32) [jruby.jar:?]
        at usr.share.logstash.vendor.bundle.jruby.$2_dot_5_dot_0.gems.logstash_minus_input_minus_tcp_minus_6_dot_2_dot_7_minus_java.lib.logstash.inputs.tcp.RUBY$method$run$0(/usr/share/logstash/vendor/bundle/jruby/2.5.0/gems/logstash-input-tcp-6.2.7-java/lib/logstash/inputs/tcp.rb:160) [jruby.jar:?]
        at usr.share.logstash.vendor.bundle.jruby.$2_dot_5_dot_0.gems.logstash_minus_input_minus_tcp_minus_6_dot_2_dot_7_minus_java.lib.logstash.inputs.tcp.RUBY$method$run$0$ __VARARGS__ (/usr/share/logstash/vendor/bundle/jruby/2.5.0/gems/logstash-input-tcp-6.2.7-java/lib/logstash/inputs/tcp.rb:156) [jruby.jar:?]
        at org.jruby.internal.runtime.methods.CompiledIRMethod.call(CompiledIRMethod.java:80) [jruby.jar:?]
        at org.jruby.internal.runtime.methods.MixedModeIRMethod.call(MixedModeIRMethod.java:70) [jruby.jar:?]
        at org.jruby.ir.targets.InvokeSite.invoke(InvokeSite.java:207) [jruby.jar:?]
        at usr.share.logstash.logstash_minus_core.lib.logstash.java_pipeline.RUBY$method$inputworker$0(/usr/share/logstash/logstash-core/lib/logstash/java_pipeline.rb:409) [jruby.jar:?]
        at usr.share.logstash.logstash_minus_core.lib.logstash.java_pipeline.RUBY$method$inputworker$0$ __VARARGS__ (/usr/share/logstash/logstash-core/lib/logstash/java_pipeline.rb:404) [jruby.jar:?]
        at org.jruby.internal.runtime.methods.CompiledIRMethod.call(CompiledIRMethod.java:80) [jruby.jar:?]
        at org.jruby.internal.runtime.methods.MixedModeIRMethod.call(MixedModeIRMethod.java:70) [jruby.jar:?]
        at org.jruby.ir.targets.InvokeSite.invoke(InvokeSite.java:207) [jruby.jar:?]
        at usr.share.logstash.logstash_minus_core.lib.logstash.java_pipeline.RUBY$block$start_input$1(/usr/share/logstash/logstash-core/lib/logstash/java_pipeline.rb:400) [jruby.jar:?]
        at org.jruby.runtime.CompiledIRBlockBody.callDirect(CompiledIRBlockBody.java:138) [jruby.jar:?]
        at org.jruby.runtime.IRBlockBody.call(IRBlockBody.java:58) [jruby.jar:?]
        at org.jruby.runtime.IRBlockBody.call(IRBlockBody.java:52) [jruby.jar:?]
        at org.jruby.runtime.Block.call(Block.java:139) [jruby.jar:?]
        at org.jruby.RubyProc.call(RubyProc.java:318) [jruby.jar:?]
        at org.jruby.internal.runtime.RubyRunnable.run(RubyRunnable.java:105) [jruby.jar:?]
        at java.lang.Thread.run(Thread.java:829) [?:?]
[2022-05-12T16:06:20,873][ERROR][logstash.javapipeline][main][4b9177771b9983d9f2ba83903e1406450d6f39c27a9e0e26d295e32f61d83781] A plugin had an unrecoverable error. Will restart this plugin.

```

Seems like a permission denied, I can imagine that this is related to Elasticsearch but credential are the right ones ! Plus, the same conf with filebeat is working fine !

Any help is appreciated.

Thx a lot

---

<div class="post-metadata">

### Author: ![sbocquet](https://sea2.discourse-cdn.com/elastic/user_avatar/discuss.elastic.co/sbocquet/32/105594_2.png) [@sbocquet](https://discuss.elastic.co/u/sbocquet)
#### Post date: [May 12, 2022, 3:12pm UTC](https://discuss.elastic.co/t/logstach-is-broken-when-using-syslog-pipeline/304584/2 "2022-05-12T15:12:42Z")

</div>

More infos... and test:

```auto
root@elasticvprd1:/etc/logstash/conf.d# curl --cacert /etc/logstash/certs/http_ca.crt -u "logstach_internal:logstach_internal" https://localhost:9200 {
  "name" : "elasticvprd1",
  "cluster_name" : "elasticsearch",
  "cluster_uuid" : "eGBp8lCBQGetrTA5-kWOwQ",
  "version" : {
    "number" : "8.2.0",
    "build_flavor" : "default",
    "build_type" : "deb",
    "build_hash" : "b174af62e8dd9f4ac4d25875e9381ffe2b9282c5",
    "build_date" : "2022-04-20T10:35:10.180408517Z",
    "build_snapshot" : false,
    "lucene_version" : "9.1.0",
    "minimum_wire_compatibility_version" : "7.17.0",
    "minimum_index_compatibility_version" : "7.0.0"
  },
  "tagline" : "You Know, for Search"
}

```

So this is not a credential problem... ☹

---

<div class="post-metadata">

### Author: ![stephenb](https://sea2.discourse-cdn.com/elastic/user_avatar/discuss.elastic.co/stephenb/32/40856_2.png) [@stephenb](https://discuss.elastic.co/u/stephenb)
#### Post date: [May 12, 2022, 3:16pm UTC](https://discuss.elastic.co/t/logstach-is-broken-when-using-syslog-pipeline/304584/3 "2022-05-12T15:16:32Z")

</div>

To me I read the error that logstash can not open port 514 to listen on...

```auto
[2022-05-12T16:06:16,833][ERROR][logstash.javapipeline][main][4b9177771b9983d9f2ba83903e1406450d6f39c27a9e0e26d295e32f61d83781] A plugin had an unrecoverable error. Will restart this plugin.
  Pipeline_id:main
  Plugin: <LogStash::Inputs::Tcp type=>"syslog", port=>514, id=>"4b9177771b9983d9f2ba83903e1406450d6f39c27a9e0e26d295e32f61d83781", enable_metric=>true, codec=><LogStash::Codecs::Line id=>"line_13d3678c-666b-4cab-bde3-efd391348ba7", enable_metric=>true, charset=>"UTF-8", delimiter=>"\n">, host=>"0.0.0.0", mode=>"server", proxy_protocol=>false, ssl_enable=>false, ssl_verify=>true, ssl_key_passphrase=><password>, tcp_keep_alive=>false, dns_reverse_lookup_enabled=>true>
  Error: Permission denied
  Exception: Java::JavaNet::SocketException
  Stack: sun.nio.ch.Net.bind0(Native Method)

```

Is there something open on that port already? or does your `sudo` have permission to open that port

Looks like it connected to Elasticsearch to me

```auto
[2022-05-12T16:06:15,470][WARN][logstash.outputs.elasticsearch][main] Restored connection to ES instance {:url=>"https://logstach_internal:xxxxxx@localhost:9200/"}

```

---

<div class="post-metadata">

### Author: ![Badger](https://sea2.discourse-cdn.com/elastic/user_avatar/discuss.elastic.co/badger/32/25190_2.png) [@Badger](https://discuss.elastic.co/u/Badger)
#### Post date: [May 12, 2022, 4:11pm UTC](https://discuss.elastic.co/t/logstach-is-broken-when-using-syslog-pipeline/304584/4 "2022-05-12T16:11:54Z")

</div>

> [@sbocquet](#):
>
> ```auto
> Plugin: <LogStash::Inputs::Tcp type=>"syslog", port=>514, 
> Error: Permission denied
> Exception: Java::JavaNet::SocketException
> 
> ```

On many UNIX systems only root can open ports 1 to 1023. You are using `sudo -u logstash`, which likely does not have permission to open the port.

If you have an ipadm command you may be able to remove that requirement for that command, otherwise there are several [other approaches](https://stackoverflow.com/questions/413807/is-there-a-way-for-non-root-processes-to-bind-to-privileged-ports-on-linux). All of which will be platform specific.

---

<div class="post-metadata">

### Author: ![sbocquet](https://sea2.discourse-cdn.com/elastic/user_avatar/discuss.elastic.co/sbocquet/32/105594_2.png) [@sbocquet](https://discuss.elastic.co/u/sbocquet)
#### Post date: [May 12, 2022, 4:29pm UTC](https://discuss.elastic.co/t/logstach-is-broken-when-using-syslog-pipeline/304584/5 "2022-05-12T16:29:23Z")

</div>

Thx for pointing that... How did I miss it !  
Just changed the port to 1514 and it works.

Last question, maybe you can help too:  
I have set this option to the Elasticsearch output  
`index => "ecs-logstach-%{+YYYY.MM.dd}"`

but I have this error  
`Invalid data stream configuration, following parameters are not supported: {"index"=>"ecs-logstach-%{+YYYY.MM.dd}"}`

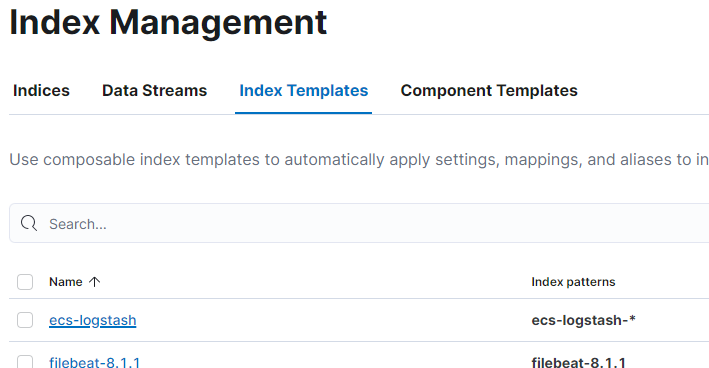
Still I can see this template plugin in Elastic Index Management page
 ![image](https://us1.discourse-cdn.com/elastic/original/3X/3/4/34f3dccd79fddfc71484d47ecca14d370470cc31.png)

---

<div class="post-metadata">

### Author: ![stephenb](https://sea2.discourse-cdn.com/elastic/user_avatar/discuss.elastic.co/stephenb/32/40856_2.png) [@stephenb](https://discuss.elastic.co/u/stephenb)
#### Post date: [May 12, 2022, 4:39pm UTC](https://discuss.elastic.co/t/logstach-is-broken-when-using-syslog-pipeline/304584/6 "2022-05-12T16:39:13Z")

</div>

It depends on what you want to do... if you want to use indices and not data streams you need to adjust some settings

[Data Streams are now the default](https://www.elastic.co/guide/en/logstash/current/plugins-outputs-elasticsearch.html#plugins-outputs-elasticsearch-data-streams) for logstash

I suspect you are trying to use indices so I believe you would need to look at [these settings](https://www.elastic.co/guide/en/logstash/current/plugins-outputs-elasticsearch.html#plugins-outputs-elasticsearch-data_stream)

`data_stream => false`

> data\_stream  
> Value can be any of: true, false and auto  
> Default is false in Logstash 7.x and auto starting in Logstash 8.0.

Or you can set up a data stream and make sure the template matches the data stream

---

<div class="post-metadata">

### Author: ![system](https://us1.discourse-cdn.com/elastic/original/3X/1/a/1ac57faf039f6b580b3f104ef42a2a89e41014de.png) [@system](https://discuss.elastic.co/u/system)
#### Post date: [June 9, 2022, 4:39pm UTC](https://discuss.elastic.co/t/logstach-is-broken-when-using-syslog-pipeline/304584/7 "2022-06-09T16:39:57Z")

</div>

This topic was automatically closed 28 days after the last reply. New replies are no longer allowed.
