# Logstash 7.17 on Windows - Pipeline running but logs are not present in Elasticsearch
**URL:** https://discuss.elastic.co/t/logstash-7-17-on-windows-pipeline-running-but-logs-are-not-present-in-elasticsearch/297519
**Category:** Logstash
**Created:** [February 17, 2022, 4:30pm UTC](https://discuss.elastic.co/t/logstash-7-17-on-windows-pipeline-running-but-logs-are-not-present-in-elasticsearch/297519 "2022-02-17T16:30:23Z")
**Posts on this page:** 7
**Page:** 1
### Author:  [@bianca6](https://discuss.elastic.co/u/bianca6)
#### Post date: [February 17, 2022, 4:30pm UTC](https://discuss.elastic.co/t/logstash-7-17-on-windows-pipeline-running-but-logs-are-not-present-in-elasticsearch/297519/1 "2022-02-17T16:30:23Z")
Hi,
I'm on Windows 10.
I'm building a pipeline with Filebeat / Logstash / Elasticsearch / Kibana. Each one of them is at the latest version (downloaded thie previous week).
I'm trying to ship a simple log file (ndjson format). It works perfectly from the Kibana interface (machine learning tab). So I guess the format is correct.
But it doesn't work via Logstash directly.
Here a line from my log file:
{"time":"2022-02-16T15:49:53.000Z", "path":"page0", "status":2}
All the tools are with default configuration.
I made few changes in the filebeat.yml file:
- I uncomment the logstash output
- Set the input path with the same path logstash use to search for the log (see config below).
This is my Logstash config file:
```auto
input {
file {
path => "C:/Users/bianca6/Documents/test_env/my_logs/logs_from_loki/*.log"
start_position => "beginning"
sincedb_path => "NULL"
}
}
output {
elasticsearch {
hosts => ["localhost:9200"]
index => "loki_logs"
}
stdout { codec => rubydebug }
}
```
This is my terminal output, I don't notice any error:
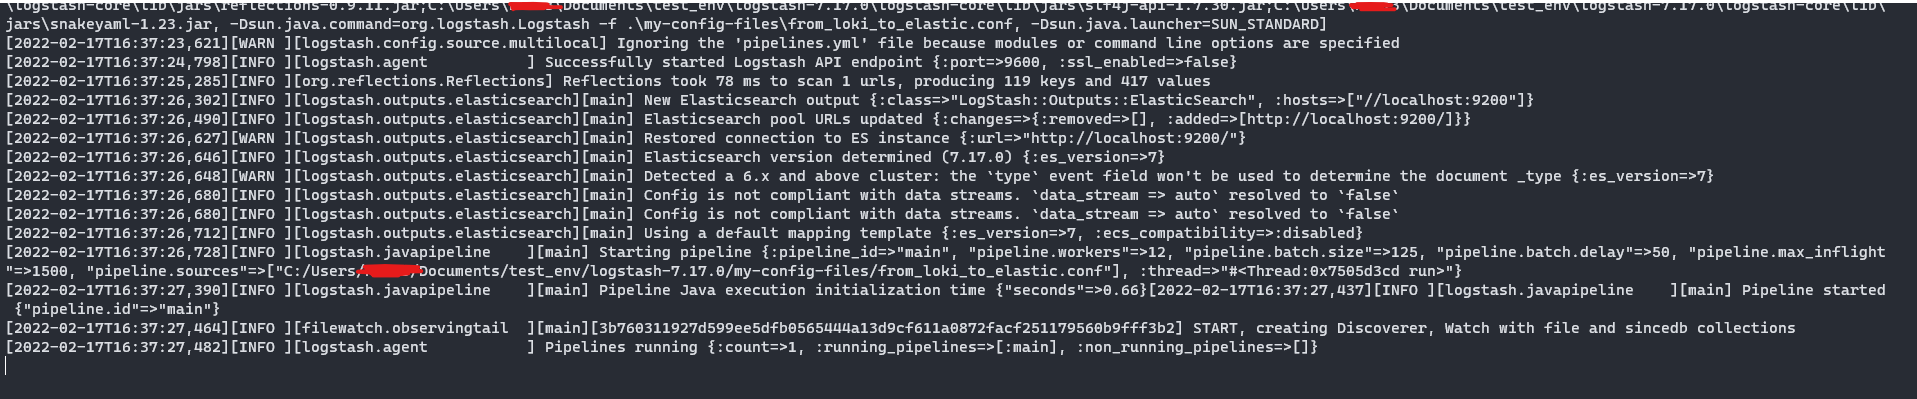
And this is it... Everything is running, and nothing appears in Kibana.
Thanks a lot for your time, does anyone have an idea?
---
### Author:  [@Badger](https://discuss.elastic.co/u/Badger)
#### Post date: [February 17, 2022, 6:13pm UTC](https://discuss.elastic.co/t/logstash-7-17-on-windows-pipeline-running-but-logs-are-not-present-in-elasticsearch/297519/2 "2022-02-17T18:13:40Z")
> [@bianca6](#):
>
> ` sincedb_path => "NULL"`
That will persist the in-memory sincedb across restarts in a file called NULL in logstash's working directory. If you do not want the sincedb persisted then use "NUL".
If that does not fix things, then set `--log.level trace` and look for [messages](https://discuss.elastic.co/t/logstash-wildcards-regex-not-working/164204/2) from the filewatch module.
---
### Author:  [@bianca6](https://discuss.elastic.co/u/bianca6)
#### Post date: [February 18, 2022, 10:33am UTC](https://discuss.elastic.co/t/logstash-7-17-on-windows-pipeline-running-but-logs-are-not-present-in-elasticsearch/297519/3 "2022-02-18T10:33:34Z")
Hi, first of all thanks for your reply!
I did:
```auto
sincedb_path => "NUL"
```
It did not fix things. So, I run with the flag:
```auto
--log.level trace
```
And I got a lot of logs. I read them all and did not see something wrong, here are few lines (I removed the timestamp and ids to make it shorter):
- Firts the path
```auto
# This is the correct path
[DEBUG][logstash.inputs.file] config LogStash::Inputs::File/@start_position = "beginning"
[DEBUG][logstash.inputs.file] config LogStash::Inputs::File/@path = ["C:/Users/bianca6/Documents/test_env/my_logs/logs_from_loki/*.log"]
[logstash.inputs.file] config LogStash::Inputs::File/@id = ""
[logstash.inputs.file] config LogStash::Inputs::File/@sincedb_path = "NUL"
```
- Then the file
```auto
[INFO][filewatch.observingtail][main][] START, creating Discoverer, Watch with file and sincedb collections
/* It found one file, and I have one */
[TRACE][filewatch.discoverer][main][] discover_files {:count=>1}
/* This is the correct filename */
[TRACE][filewatch.discoverer][main][] handling: {:new_discovery=>true, :watched_file=>""}
```
- Finaly, an endless loop like this
```auto
[DEBUG][logstash.instrument.periodicpoller.jvm] collector name {:name=>"scavenge"}
[DEBUG][logstash.instrument.periodicpoller.jvm] collector name {:name=>"global"}
[filewatch.tailmode.processor][main][] process_closed
[filewatch.tailmode.processor][main][] process_ignored
[TRACE][filewatch.tailmode.processor][main][] process_delayed_delete
[TRACE][filewatch.tailmode.processor][main][] process_restat_for_watched_and_active
[TRACE][filewatch.tailmode.processor][main][] process_rotation_in_progress
[TRACE][filewatch.tailmode.processor][main][] process_watched
[TRACE][filewatch.tailmode.processor][main][] process_active
[TRACE][filewatch.tailmode.processor][main][] process_active no change {:path=>"1645027880.log"}
[TRACE][filewatch.tailmode.processor][main][] process_closed
```
I see the same steps again and again, but I think this is just my pipeline running and waiting new files? Or is it an error?
Final result is, I still don't have any logs on Elas/Kib...
---
### Author:  [@Badger](https://discuss.elastic.co/u/Badger)
#### Post date: [February 18, 2022, 5:34pm UTC](https://discuss.elastic.co/t/logstash-7-17-on-windows-pipeline-running-but-logs-are-not-present-in-elasticsearch/297519/4 "2022-02-18T17:34:46Z")
> [@bianca6](#):
>
> `[TRACE][filewatch.discoverer][main][] handling: {:new_discovery=>true, :watched_file=>""}`
OK, so it found the file. It says the file size is 64000, it has not read anything from the file (@bytes\_read=0), and does not think it needs to read anything from the file (@bytes\_unread=0). That would suggest either `start_position => "end"`, or sincedb\_path != "NUL", neither of which is true. I cannot explain it.
---
### Author:  [@bianca6](https://discuss.elastic.co/u/bianca6)
#### Post date: [February 22, 2022, 12:29pm UTC](https://discuss.elastic.co/t/logstash-7-17-on-windows-pipeline-running-but-logs-are-not-present-in-elasticsearch/297519/5 "2022-02-22T12:29:39Z")
Is there any log which can tell me something as "I'm Logstash, I sent to Elasticsearch this and that" and "I'm Elasticsearch, I just received from Logstash this and that"?
---
### Author:  [@bianca6](https://discuss.elastic.co/u/bianca6)
#### Post date: [February 24, 2022, 10:56am UTC](https://discuss.elastic.co/t/logstash-7-17-on-windows-pipeline-running-but-logs-are-not-present-in-elasticsearch/297519/6 "2022-02-24T10:56:03Z")
Hey,
Configuration was good except the Grok.
Just added it and it works fine.
For my case it looks like this:
```auto
filter {
grok {
match => {"message" => '"%{TIMESTAMP_ISO8601:timestamp}" "%{WORD:mymetric}" %{INT:myvalue}'}
}
}
```
---
### Author:  [@system](https://discuss.elastic.co/u/system)
#### Post date: [March 24, 2022, 10:56am UTC](https://discuss.elastic.co/t/logstash-7-17-on-windows-pipeline-running-but-logs-are-not-present-in-elasticsearch/297519/7 "2022-03-24T10:56:20Z")
This topic was automatically closed 28 days after the last reply. New replies are no longer allowed.