### Author:  [@ashiqab](https://discuss.elastic.co/u/ashiqab)
#### Post date: [March 21, 2022, 6:18am UTC](https://discuss.elastic.co/t/logstash-set-up-issue/300160/1 "2022-03-21T06:18:07Z")
Hello,
I am struggling with my logstash set up, which doesn't seem to be connected to the ELK stack.
I cannot see Logstash under Stack Monitoring:

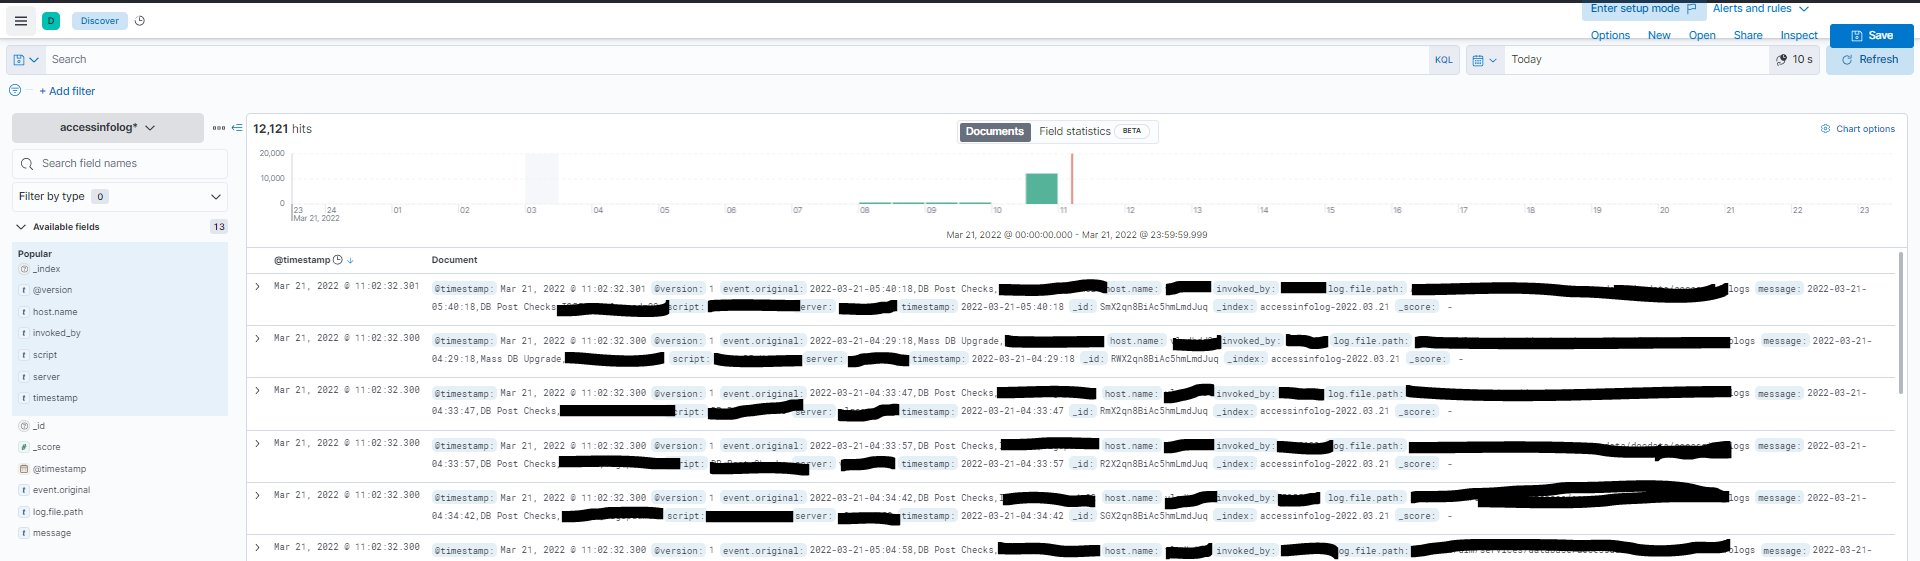
However, I can see my custom log data which is ingested using logstash config file in the Discover page:
Here is my logstash.yml file:
pipeline.batch.size: 125
pipeline.batch.delay: 5
node.name: dlmlogstash
path.data: /var/lib/logstash/
pipeline.id: main
pipeline.workers: 2
path.config:/etc/logstash/conf.d/
log.level: info
path.logs: /usr/share/logstash/logs/
output.Elasticsearch:
hosts: ["[http://10.177.36.103:9200](http://10.177.36.103:9200)"]
username: "elastic"
password: "passwd"
Here is the logtstash plain log file:
:/usr/share/logstash/logs # cat logstash-plain.log
[2022-03-21T06:31:54,397][INFO][logstash.runner] Log4j configuration path used is: /etc/logstash/log4j2.properties
[2022-03-21T06:31:54,501][INFO][logstash.runner] Starting Logstash {"logstash.version"=\>"8.1.0", "jruby.version"=\>"jruby 9.2.20.1 (2.5.8) 2021-11-30 2a2962fbd1 OpenJDK 64-Bit Server VM 11.0.13+8 on 11.0.13+8 +indy +jit [linux-x86\_64]"}
[2022-03-21T06:31:54,505][INFO][logstash.runner] JVM bootstrap flags: [-Xms1g, -Xmx1g, -XX:+UseConcMarkSweepGC, -XX:CMSInitiatingOccupancyFraction=75, -XX:+UseCMSInitiatingOccupancyOnly, -Djava.awt.headless=true, -Dfile.encoding=UTF-8, -Djruby.compile.invokedynamic=true, -Djruby.jit.threshold=0, -Djruby.regexp.interruptible=true, -XX:+HeapDumpOnOutOfMemoryError, -Djava.security.egd=file:/dev/urandom, -Dlog4j2.isThreadContextMapInheritable=true, --add-opens=java.base/java.security=ALL-UNNAMED, --add-opens=java.base/java.io=ALL-UNNAMED, --add-opens=java.base/java.nio.channels=ALL-UNNAMED, --add-opens=java.base/sun.nio.ch=ALL-UNNAMED, --add-opens=java.management/sun.management=ALL-UNNAMED]
[2022-03-21T06:31:59,682][INFO][logstash.agent] Successfully started Logstash API endpoint {:port=\>9600, :ssl\_enabled=\>false}
[2022-03-21T06:32:01,754][INFO][org.reflections.Reflections] Reflections took 152 ms to scan 1 urls, producing 120 keys and 417 values
[2022-03-21T06:32:02,744][INFO][logstash.javapipeline] Pipeline `main` is configured with `pipeline.ecs_compatibility: v8` setting. All plugins in this pipeline will default to `ecs_compatibility => v8` unless explicitly configured otherwise.
[2022-03-21T06:32:02,840][INFO][logstash.outputs.Elasticsearch][main] New Elasticsearch output {:class=\>"LogStash::Outputs::Elasticsearch", :hosts=\>["[http://localhost:9200](http://localhost:9200)"]}
[2022-03-21T06:32:03,221][INFO][logstash.outputs.Elasticsearch][main] Elasticsearch pool URLs updated {:changes=\>{:removed=\>, :added=\>[[http://elastic:xxxxxx@localhost:9200/](http://elastic:xxxxxx@localhost:9200/)]}}
[2022-03-21T06:32:03,578][WARN][logstash.outputs.Elasticsearch][main] Restored connection to ES instance {:url=\>"[http://elastic:xxxxxx@localhost:9200/](http://elastic:xxxxxx@localhost:9200/)"}
[2022-03-21T06:32:03,602][INFO][logstash.outputs.Elasticsearch][main] Elasticsearch version determined (8.1.0) {:es\_version=\>8}
[2022-03-21T06:32:03,604][WARN][logstash.outputs.Elasticsearch][main] Detected a 6.x and above cluster: the `type` event field won't be used to determine the document \_type {:es\_version=\>8}
[2022-03-21T06:32:03,662][INFO][logstash.outputs.Elasticsearch][main] Config is not compliant with data streams. `data_stream => auto` resolved to `false`
[2022-03-21T06:32:03,674][WARN][logstash.outputs.Elasticsearch][main] Elasticsearch Output configured with `ecs_compatibility => v8`, which resolved to an UNRELEASED preview of version 8.0.0 of the Elastic Common Schema. Once ECS v8 and an updated release of this plugin are publicly available, you will need to update this plugin to resolve this warning.
[2022-03-21T06:32:03,683][INFO][logstash.filters.csv][main] ECS compatibility is enabled but `target` option was not specified. This may cause fields to be set at the top-level of the event where they are likely to clash with the Elastic Common Schema. It is recommended to set the `target` option to avoid potential schema conflicts (if your data is ECS compliant or non-conflicting, feel free to ignore this message)
[2022-03-21T06:32:03,778][INFO][logstash.outputs.Elasticsearch][main] Using a default mapping template {:es\_version=\>8, :ecs\_compatibility=\>:v8}
[2022-03-21T06:32:03,792][INFO][logstash.javapipeline][main] Starting pipeline {:pipeline\_id=\>"main", "pipeline.workers"=\>2, "pipeline.batch.size"=\>125, "pipeline.batch.delay"=\>5, "pipeline.max\_inflight"=\>250, "pipeline.sources"=\>["/etc/logstash/conf.d/accessinfologs.conf"], :thread=\>"#\"}
[2022-03-21T06:32:05,053][INFO][logstash.javapipeline][main] Pipeline Java execution initialization time {"seconds"=\>1.26}
[2022-03-21T06:32:05,110][INFO][logstash.javapipeline][main] Pipeline started {"pipeline.id"=\>"main"}
[2022-03-21T06:32:05,199][INFO][logstash.agent] Pipelines running {:count=\>1, :running\_pipelines=\>[:main], :non\_running\_pipelines=\>}
[2022-03-21T06:32:05,282][INFO][filewatch.observingtail][main][4fcf4613d7e3f499d5c8b5cbce618307f02989afad0cf42430120ed62fcae652] START, creating Discoverer, Watch with file and sincedb collections
Could you please check and let me know what i miss in my set up?
Thanks and regards,
Ashiq Aboo Backer
---
### Author:  [@zx8086](https://discuss.elastic.co/u/zx8086)
#### Post date: [March 21, 2022, 8:03am UTC](https://discuss.elastic.co/t/logstash-set-up-issue/300160/2 "2022-03-21T08:03:52Z")
Hi @ashiqab ,
Have you installed metricbeat on your logstash node and enabled the logstash-xpack module ?
> **[Collect Logstash monitoring data with Metricbeat | Logstash Reference \[8.1\] |...](https://www.elastic.co/guide/en/logstash/current/monitoring-with-metricbeat.html)**
---
### Author:  [@ashiqab](https://discuss.elastic.co/u/ashiqab)
#### Post date: [March 21, 2022, 10:40am UTC](https://discuss.elastic.co/t/logstash-set-up-issue/300160/3 "2022-03-21T10:40:04Z")
Hello @zx8086,
Thanks for looking into this. Yes I have metricbeat set up:
Here is my metricbeat.yml file:
metricbeat.config.modules:
path: ${path.config}/modules.d/\*.yml
reload.enabled: true
reload.period: 10s
setup.template.settings:
index.number\_of\_shards: 1
index.codec: best\_compression
name: lddbdd2
setup.kibana:
host: "10.177.36.103:5601"
output.Elasticsearch:
hosts: ["10.177.36.103:9200"]
protocol: "http"
username: "elastic"
password: "psswd"
processors:
- add\_host\_metadata: ~
- add\_cloud\_metadata: ~
- add\_docker\_metadata: ~
- add\_kubernetes\_metadata: ~
logging.level: info
logging.selectors: ["\*"]
logging.to\_files: true
logging.files:
path: /var/log/metricbeat
name: metricbeat
keepfiles: 7
permissions: 0644
monitoring.enabled: true
monitoring.Elasticsearch:
Here is my logstash-xpack.yml:
- module: logstash
metricsets:
- node
- node\_stats
xpack.enabled: true
period: 10s
hosts: ["10.177.36.103:9600"]
#username: "elastic"
#password: "passwd"
Thanks,
Ashiq
---
### Author:  [@zx8086](https://discuss.elastic.co/u/zx8086)
#### Post date: [March 21, 2022, 10:43am UTC](https://discuss.elastic.co/t/logstash-set-up-issue/300160/4 "2022-03-21T10:43:25Z")
what does your metricbeat log on the Logstash node say ?
It should give you an indication if metricbeat is collecting the metric and also if it is sending it to your Elasticsearch cluster that is doing the monitoring.
Have you setup the templates for metricbeat on the Elasticsearch cluster.
---
### Author:  [@ashiqab](https://discuss.elastic.co/u/ashiqab)
#### Post date: [March 24, 2022, 6:06am UTC](https://discuss.elastic.co/t/logstash-set-up-issue/300160/5 "2022-03-24T06:06:33Z")
Thanks dear [zx8086](https://discuss.elastic.co/u/zx8086) for directing my attention towards metricbeat log.
I was able to find the error "error making http request: Get "[http://x.x.x](http://x.x.x).:9600" when I used the ip for the server. Instead when I changed to the loopback ip 127.0.0.1:9600 in logstash-xpack.yml, the error stopped and logstash is now being monitored by Metricbeat.
Thanks for your valuable feedback!
Best regards,
Ashiq
---
### Author:  [@system](https://discuss.elastic.co/u/system)
#### Post date: [April 21, 2022, 6:06am UTC](https://discuss.elastic.co/t/logstash-set-up-issue/300160/6 "2022-04-21T06:06:47Z")
This topic was automatically closed 28 days after the last reply. New replies are no longer allowed.