# Manually add geo point to server logs
**URL:** https://discuss.elastic.co/t/manually-add-geo-point-to-server-logs/285793
**Category:** Logstash
**Created:** [October 4, 2021, 8:50am UTC](https://discuss.elastic.co/t/manually-add-geo-point-to-server-logs/285793 "2021-10-04T08:50:24Z")
**Posts on this page:** 7
**Page:** 1
### Author:  [@maltewhiite](https://discuss.elastic.co/u/maltewhiite)
#### Post date: [October 4, 2021, 8:50am UTC](https://discuss.elastic.co/t/manually-add-geo-point-to-server-logs/285793/1 "2021-10-04T08:50:24Z")
How do I add the location of our servers as a geo-point that can be used with Kibana Maps to the logs of that server?
For example:
Let's say a log has agent.name "AgentExample01", then I would match on that, and add lat and lon, so I could see that "AgentExample01" and visualize its logs on a Kibana Map.
I want to be able to visualize our data on a map. Because it is coming from 100+ places in our country. But I don't know how to manually add the location of the servers to the incoming logs.
For example I'd like to be able to see Uptime on a Map. If a server doesn't respond via Heartbeat, then I'd like to see a Red dot on the map.
Or if it has high CPU usage and/or Load, then I'd like to put a yellow dot on the map where that server is.
---
### Author:  [@jsanz](https://discuss.elastic.co/u/jsanz)
#### Post date: [October 4, 2021, 1:45pm UTC](https://discuss.elastic.co/t/manually-add-geo-point-to-server-logs/285793/2 "2021-10-04T13:45:59Z")
The correct way to do this would be to add in your servers' beats configuration their location, so they add to each event their proper metadata in the Elastic Common Schema.
> **[Add Observer metadata | Heartbeat Reference \[7.15\] | Elastic](https://www.elastic.co/guide/en/beats/heartbeat/current/add-observer-metadata.html)**
It's documented in the [heartbeat installation guide](https://www.elastic.co/guide/en/beats/heartbeat/current/heartbeat-installation-configuration.html#configurelocation) and on [this guide](https://www.elastic.co/guide/en/beats/heartbeat/current/configuration-observer-options.html).
With the geo metadata the Uptime app, part of the Observability solution, will show you a map as described in [this blog post](https://www.elastic.co/blog/service-monitoring-and-availability-made-simple-with-elastic-uptime-and-heartbeat).

* * *
Another way would be to use the [Elastic Maps](https://www.elastic.co/guide/en/kibana/current/maps.html) instead, create a new index with the server locations (for example [uploading a GeoJSON file](https://www.elastic.co/guide/en/kibana/current/import-geospatial-data.html) in Kibana Maps), and then create a map that does the [Term Join](https://www.elastic.co/guide/en/kibana/current/terms-join.html) in the browser to count (fo example) the number of measurements in the last `X` minutes.
Hope it helps.
---
### Author:  [@maltewhiite](https://discuss.elastic.co/u/maltewhiite)
#### Post date: [October 4, 2021, 1:47pm UTC](https://discuss.elastic.co/t/manually-add-geo-point-to-server-logs/285793/3 "2021-10-04T13:47:11Z")
Thanks a lot! Will try this tomorrow. Attaching it to our internal issue.
---
### Author:  [@maltewhiite](https://discuss.elastic.co/u/maltewhiite)
#### Post date: [October 4, 2021, 2:38pm UTC](https://discuss.elastic.co/t/manually-add-geo-point-to-server-logs/285793/4 "2021-10-04T14:38:28Z")
Made a quick attempt with the Term Join method, but it doesn't seem to work for us: 
Trying the other method tomorrow
---
### Author:  [@maltewhiite](https://discuss.elastic.co/u/maltewhiite)
#### Post date: [October 5, 2021, 11:36am UTC](https://discuss.elastic.co/t/manually-add-geo-point-to-server-logs/285793/5 "2021-10-05T11:36:35Z")
Is there an easy way to do this when you manage the Beats with Puppet?
---
### Author:  [@zx8086](https://discuss.elastic.co/u/zx8086)
#### Post date: [October 5, 2021, 11:46am UTC](https://discuss.elastic.co/t/manually-add-geo-point-to-server-logs/285793/6 "2021-10-05T11:46:55Z")
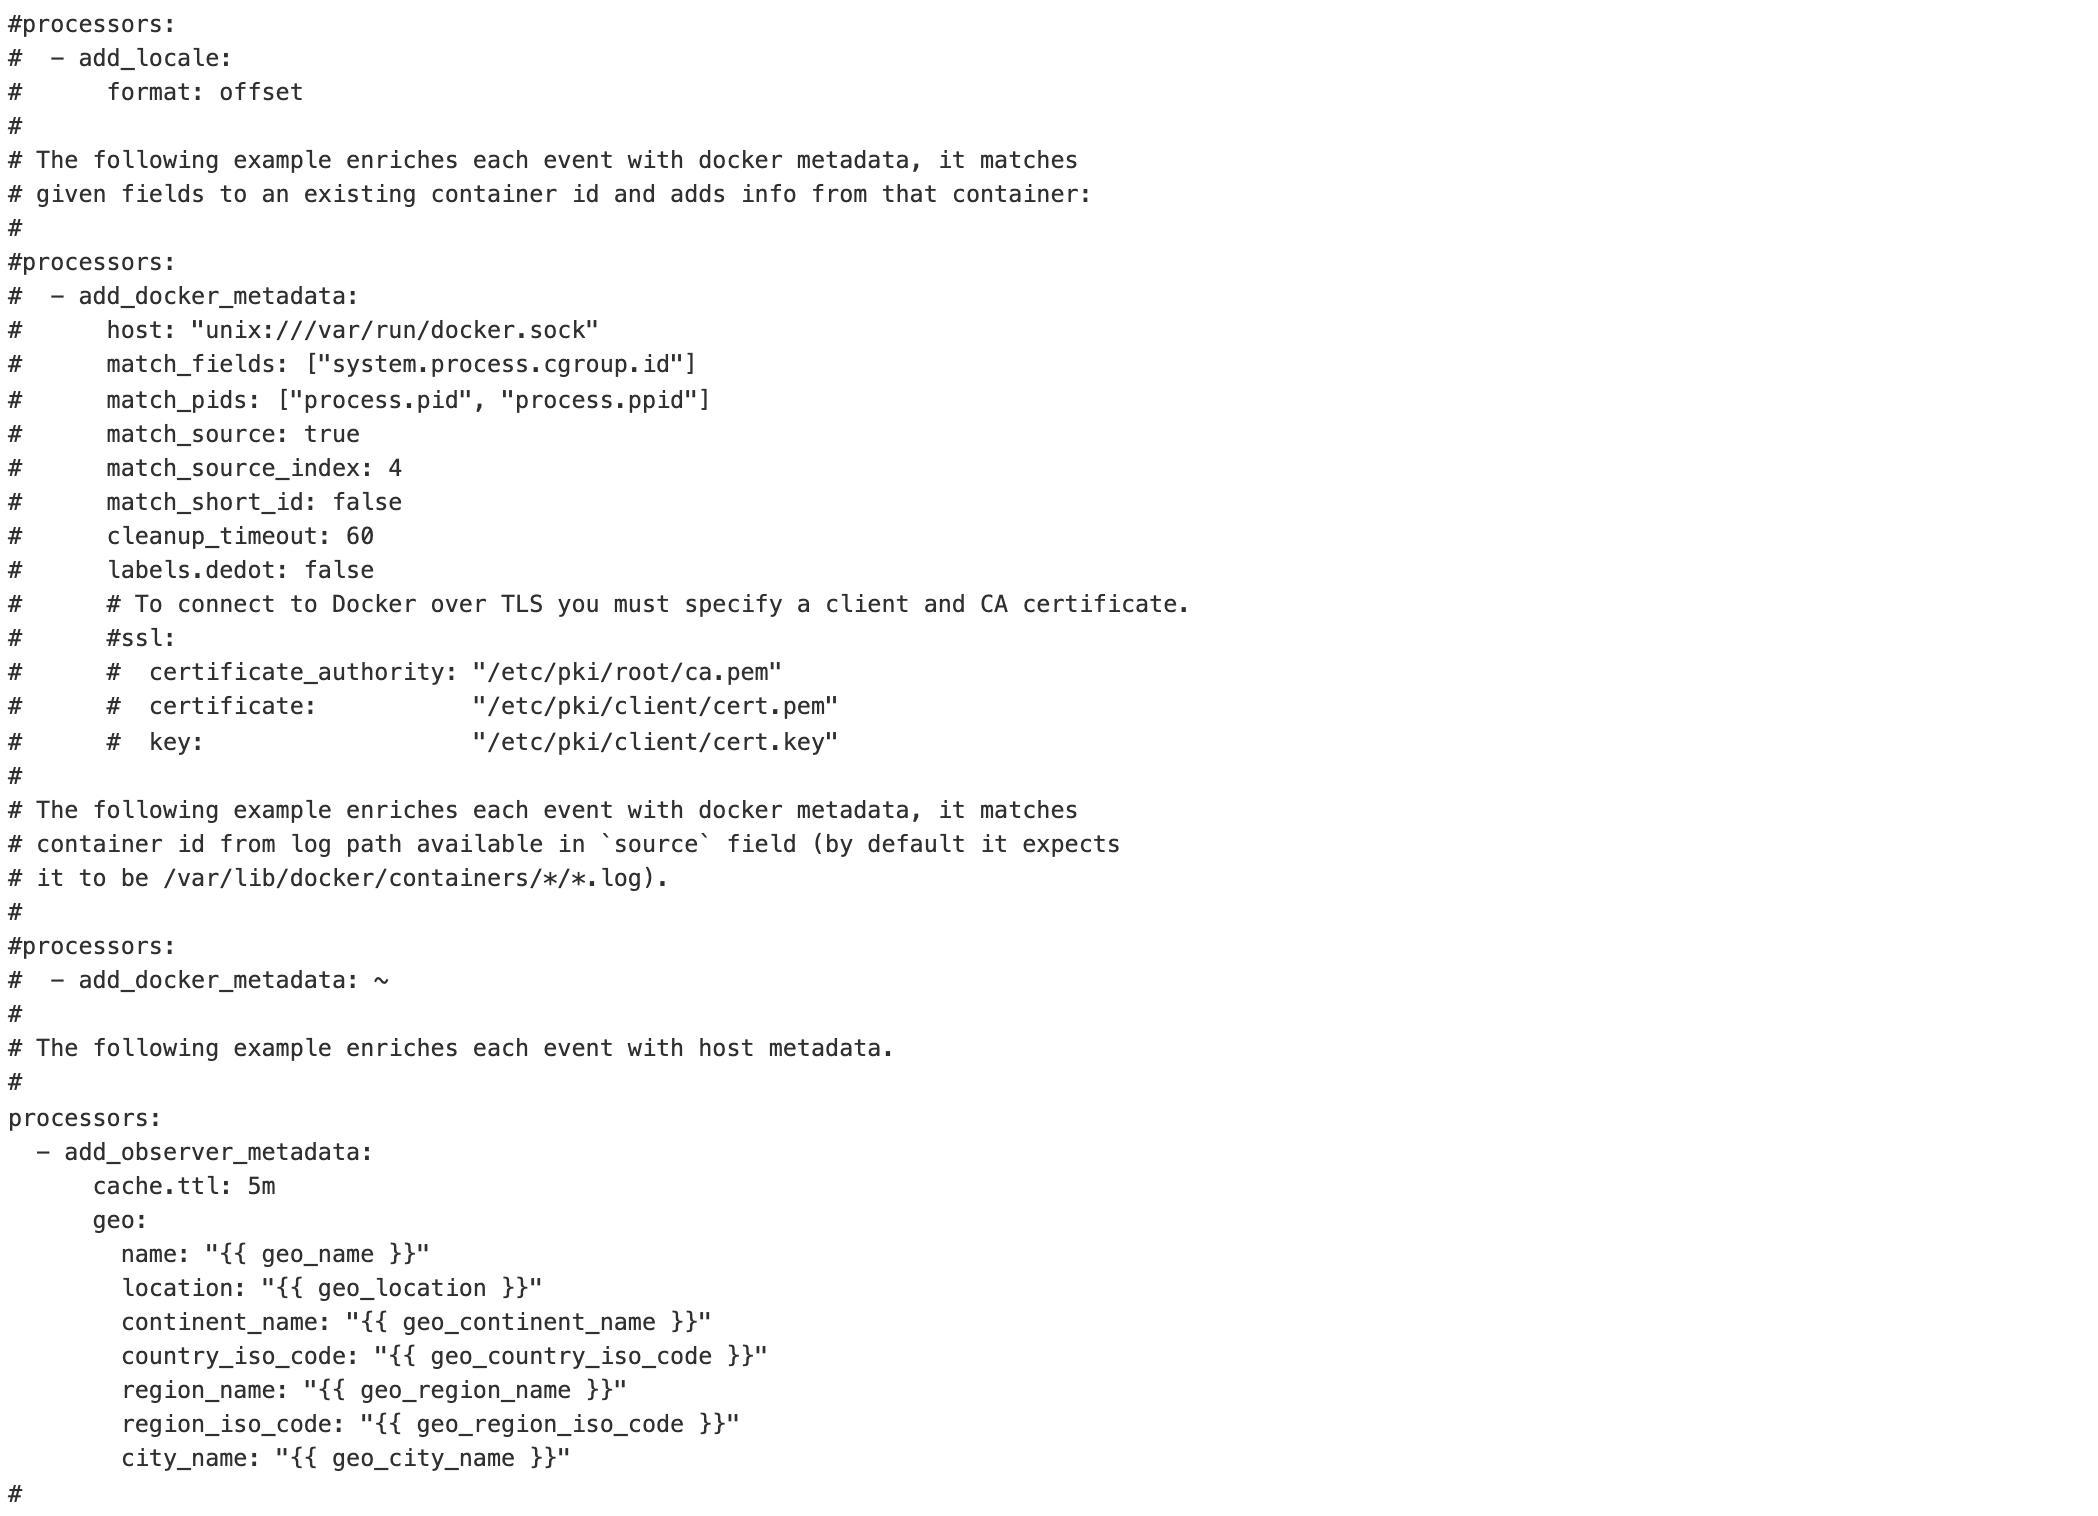
@maltewhiite I manage this through Ansible, using the Add Observer Data as mentioned.
So with each deployment of a beats shippers, the variables are substituted with the actual geo locations from a reference file.

---
### Author:  [@system](https://discuss.elastic.co/u/system)
#### Post date: [November 2, 2021, 11:47am UTC](https://discuss.elastic.co/t/manually-add-geo-point-to-server-logs/285793/7 "2021-11-02T11:47:47Z")
This topic was automatically closed 28 days after the last reply. New replies are no longer allowed.