### Author:  [@Patr123](https://discuss.elastic.co/u/Patr123)
#### Post date: [January 14, 2024, 5:12pm UTC](https://discuss.elastic.co/t/metrics-system-overview-dashboard-redirects-to-a-404-dashboard-not-found-page-in-kibana/351033/1 "2024-01-14T17:12:59Z")
Hello,
We are using Kibana v8.10.4 and have installed elastic agent on one linux and a windows system.
I do see logs/metrics coming in and see the dashboard visualizations getting populated for the Metrics system overview dashboard. But if I click the host name in that dashboard it takes me to different page which results into a 404 dashboard not found page. Please check the attached screenshots


Is anyone experiencing the same issue and how can I fix this?
Thank you in advance.
---
### Author:  [@carly.richmond](https://discuss.elastic.co/u/carly.richmond)
#### Post date: [January 16, 2024, 10:02am UTC](https://discuss.elastic.co/t/metrics-system-overview-dashboard-redirects-to-a-404-dashboard-not-found-page-in-kibana/351033/2 "2024-01-16T10:02:28Z")
Hi @Patr123,
Welcome back! I assume you are usingThat looks like a potential bug to me. Can you raise a [GitHub bug request issue for Kibana](https://github.com/elastic/kibana/issues/new/choose) with the details and the URL resulting in a 404 and we'll take a look.
If you need help raising the issue let me know and provide the URL generating the 404 error.
Hope that helps!
---
### Author:  [@Patr123](https://discuss.elastic.co/u/Patr123)
#### Post date: [January 17, 2024, 9:24pm UTC](https://discuss.elastic.co/t/metrics-system-overview-dashboard-redirects-to-a-404-dashboard-not-found-page-in-kibana/351033/3 "2024-01-17T21:24:44Z")
Hello,
I have created the issue:
>
>
> \*\*Kibana version:\*\*
> 8.11.2
> \*\*Elasticsearch version:\*\*
> 8.11.2
> \*\*Server OS ver…sion:\*\*
> Linux
> \*\*Browser version:\*\*
> Chrome
> \*\*Browser OS version:\*\*
> Version 120.0.6099.216 (Official Build) (arm64)
> \*\*Original install method (e.g. download page, yum, from source, etc.):\*\*
> Using the Elastic integration
> \*\*Describe the bug:\*\*
> We have elastic agent v8.10.4 running on a windows and a linux device. They are able to send the metrics information to the elastic node. If I open the Metrics system overview dashboard it shows me the overview of the system health but if I click on the system name it redirects me to the 404 dashboard not found page.
> I have tried the same issue with kibana version v8.10.4 and v8.11.2. My agent is still running on v8.10.4
> \*\*Steps to reproduce:\*\*
> 1. Install Elastic agent on windows/linux device
> 2. Search Metrics system overview dashboard and open it.
> 3. Click on the hostname which redirectes you to a new page and gives the 404 dashboard not found error message.
>
> \*\*Expected behavior:\*\*
> After clicking the hostname it should redirect to Metrics system host overview dashboard
> \*\*Screenshots (if relevant):\*\*
> \ > \
> \ >
> \*\*Errors in browser console (if relevant):\*\*
>
> \*\*Provide logs and/or server output (if relevant):\*\*
>
> \*\*Any additional context:\*\*
> I just did a reverse test, which is to open the \[Metrics System\] Host overview dashboard and click on the System overview link in it. It takes me to the 404 dashboard not found page again.
> \
>
> \*\*Errors in browser console (if relevant):\*\*
>
> \*\*Provide logs and/or server output (if relevant):\*\*
>
> \*\*Any additional context:\*\*
> I just did a reverse test, which is to open the \[Metrics System\] Host overview dashboard and click on the System overview link in it. It takes me to the 404 dashboard not found page again.
> \ > \
> \ ---
---
### Author:  [@stephenb](https://discuss.elastic.co/u/stephenb)
#### Post date: [January 17, 2024, 9:36pm UTC](https://discuss.elastic.co/t/metrics-system-overview-dashboard-redirects-to-a-404-dashboard-not-found-page-in-kibana/351033/4 "2024-01-17T21:36:24Z")
@Patr123
Curious if you have a proxy or changed the serverbaseURL on kibana?
Can you share what your URLs look like (sanitized if needed)
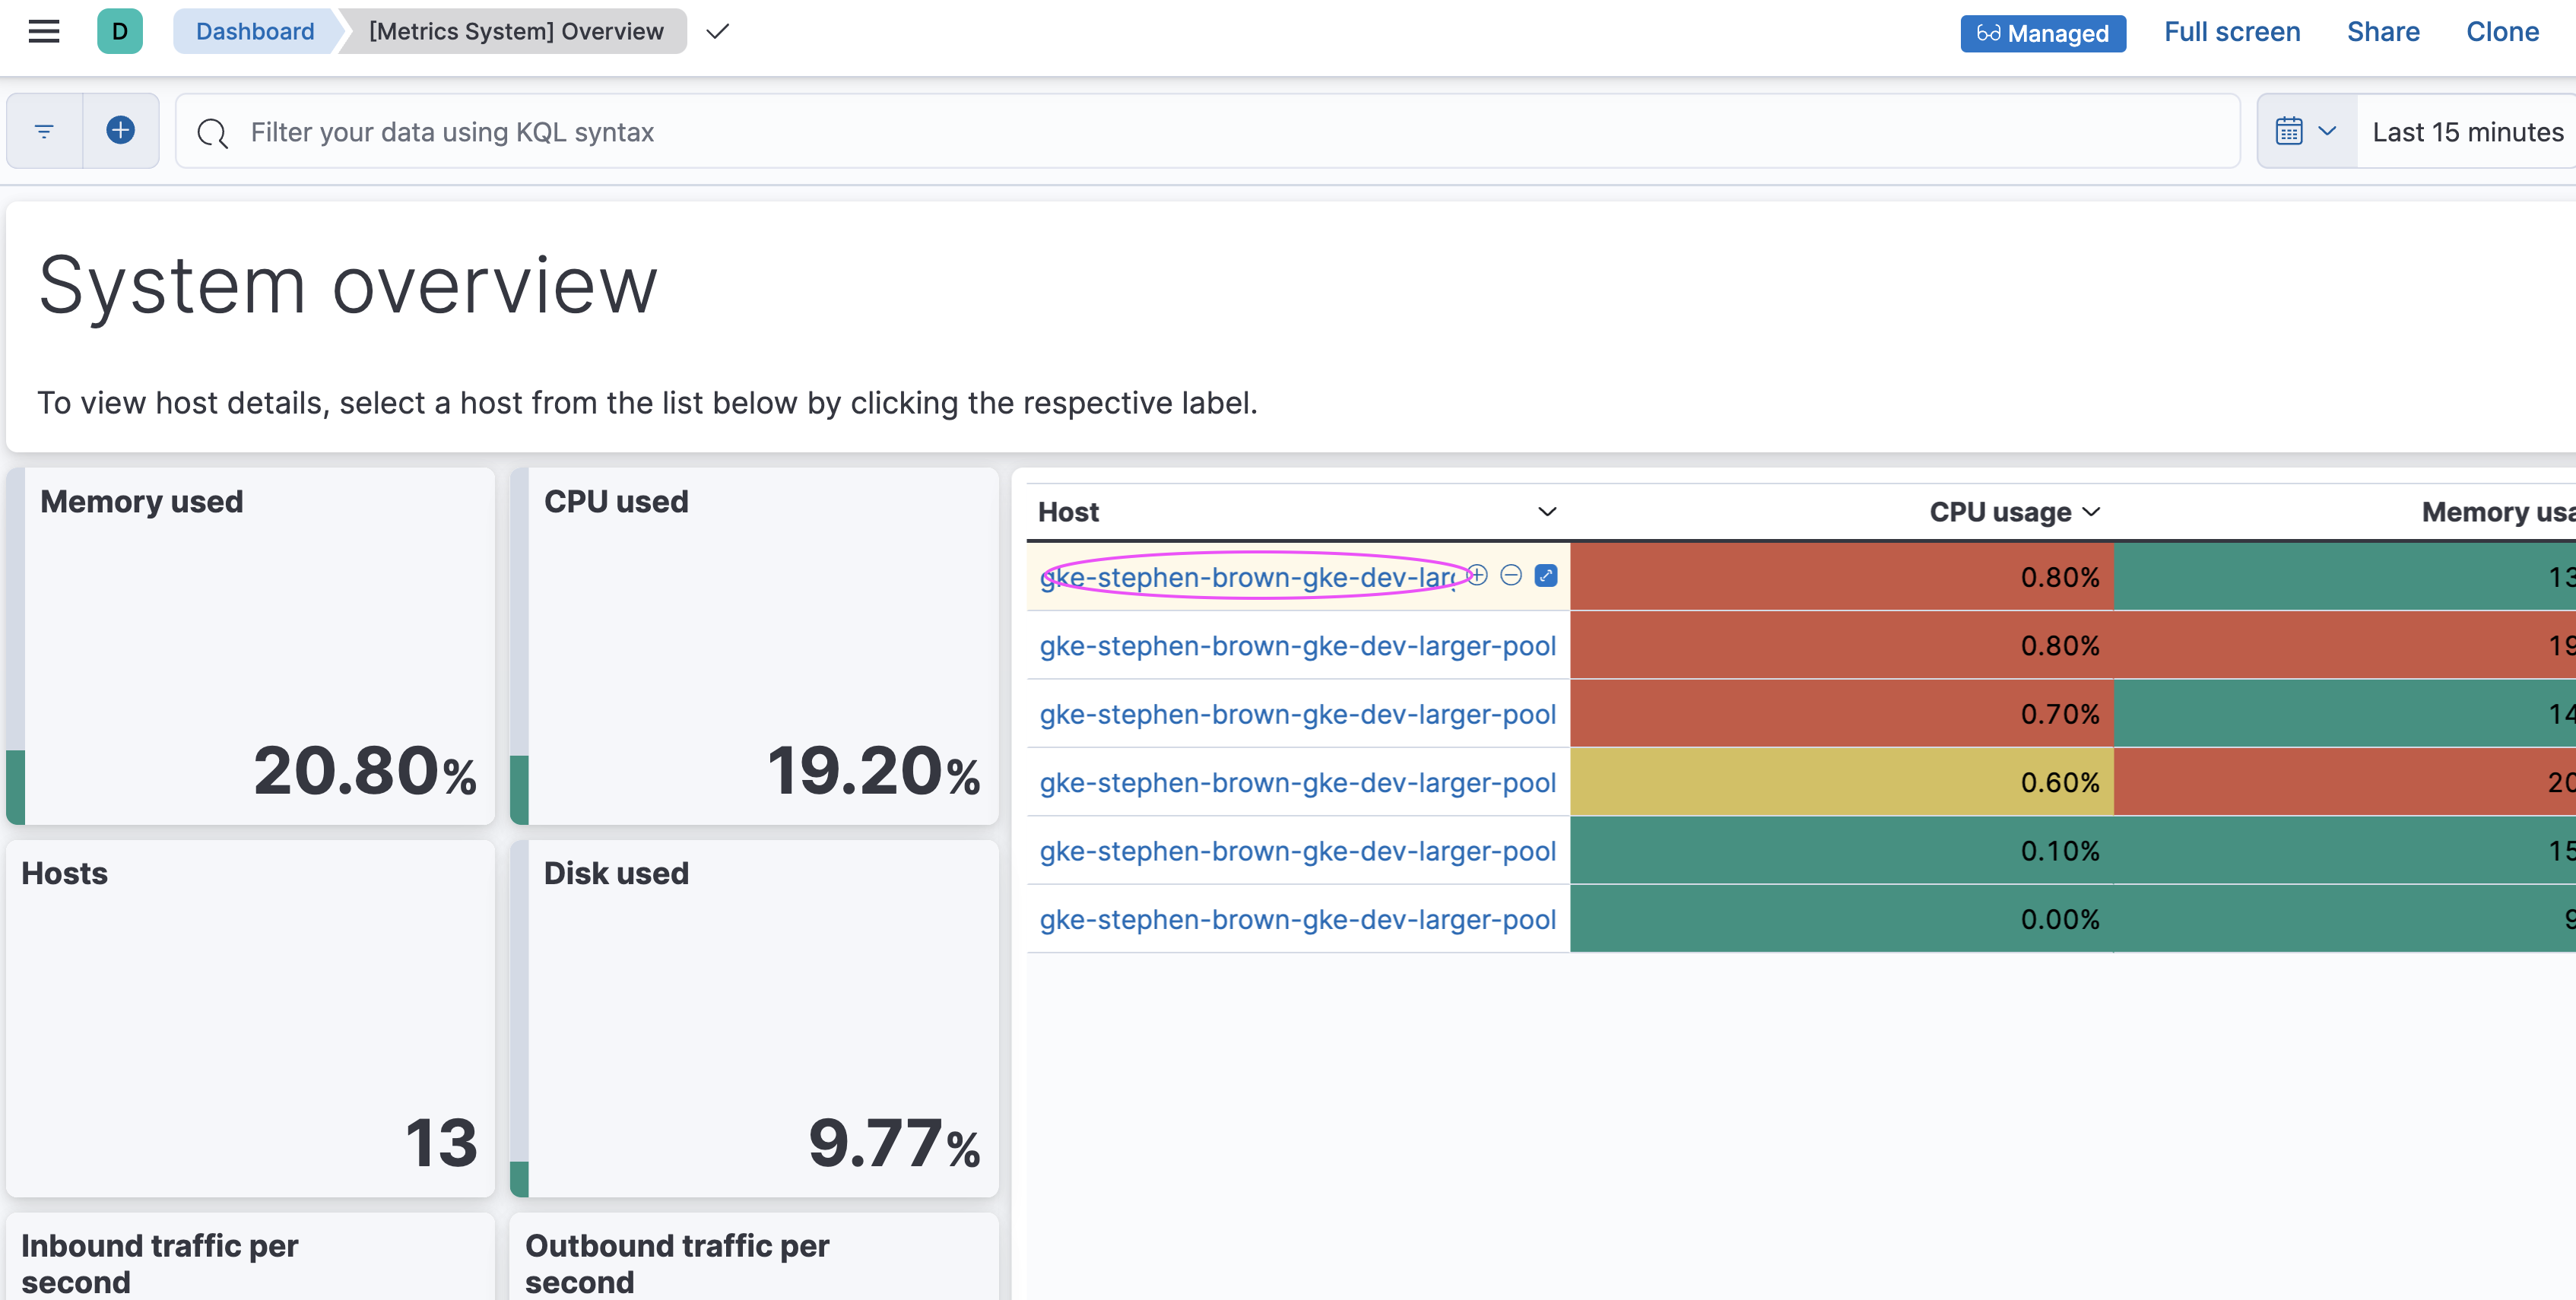
I am curious if you have updated the Assets for the System Package.
I am running Elastic Agent 8.11.3 and 8.11.4 and am not seeing any issues.
Mine is working both forward and back in Elastic Cloud

---
### Author:  [@Patr123](https://discuss.elastic.co/u/Patr123)
#### Post date: [January 18, 2024, 12:58am UTC](https://discuss.elastic.co/t/metrics-system-overview-dashboard-redirects-to-a-404-dashboard-not-found-page-in-kibana/351033/5 "2024-01-18T00:58:07Z")
Hello @ [stephenb](https://discuss.elastic.co/u/stephenb),
My Kibana config looks like:
```auto
config:
server.publicBaseUrl: https://kibana.mydomain.local
```
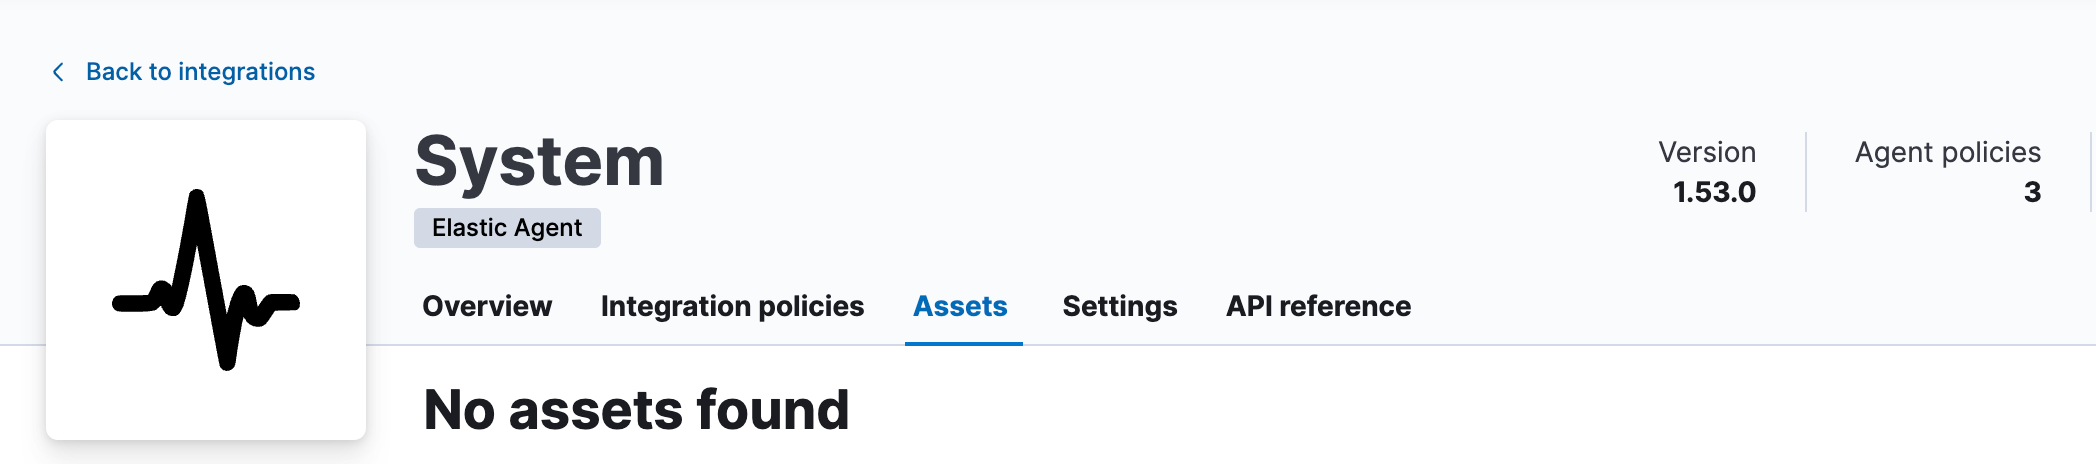
Also I checked the assets for the system package and I see `No Assets Found` message:

---
### Author:  [@stephenb](https://discuss.elastic.co/u/stephenb)
#### Post date: [January 18, 2024, 1:10am UTC](https://discuss.elastic.co/t/metrics-system-overview-dashboard-redirects-to-a-404-dashboard-not-found-page-in-kibana/351033/6 "2024-01-18T01:10:32Z")
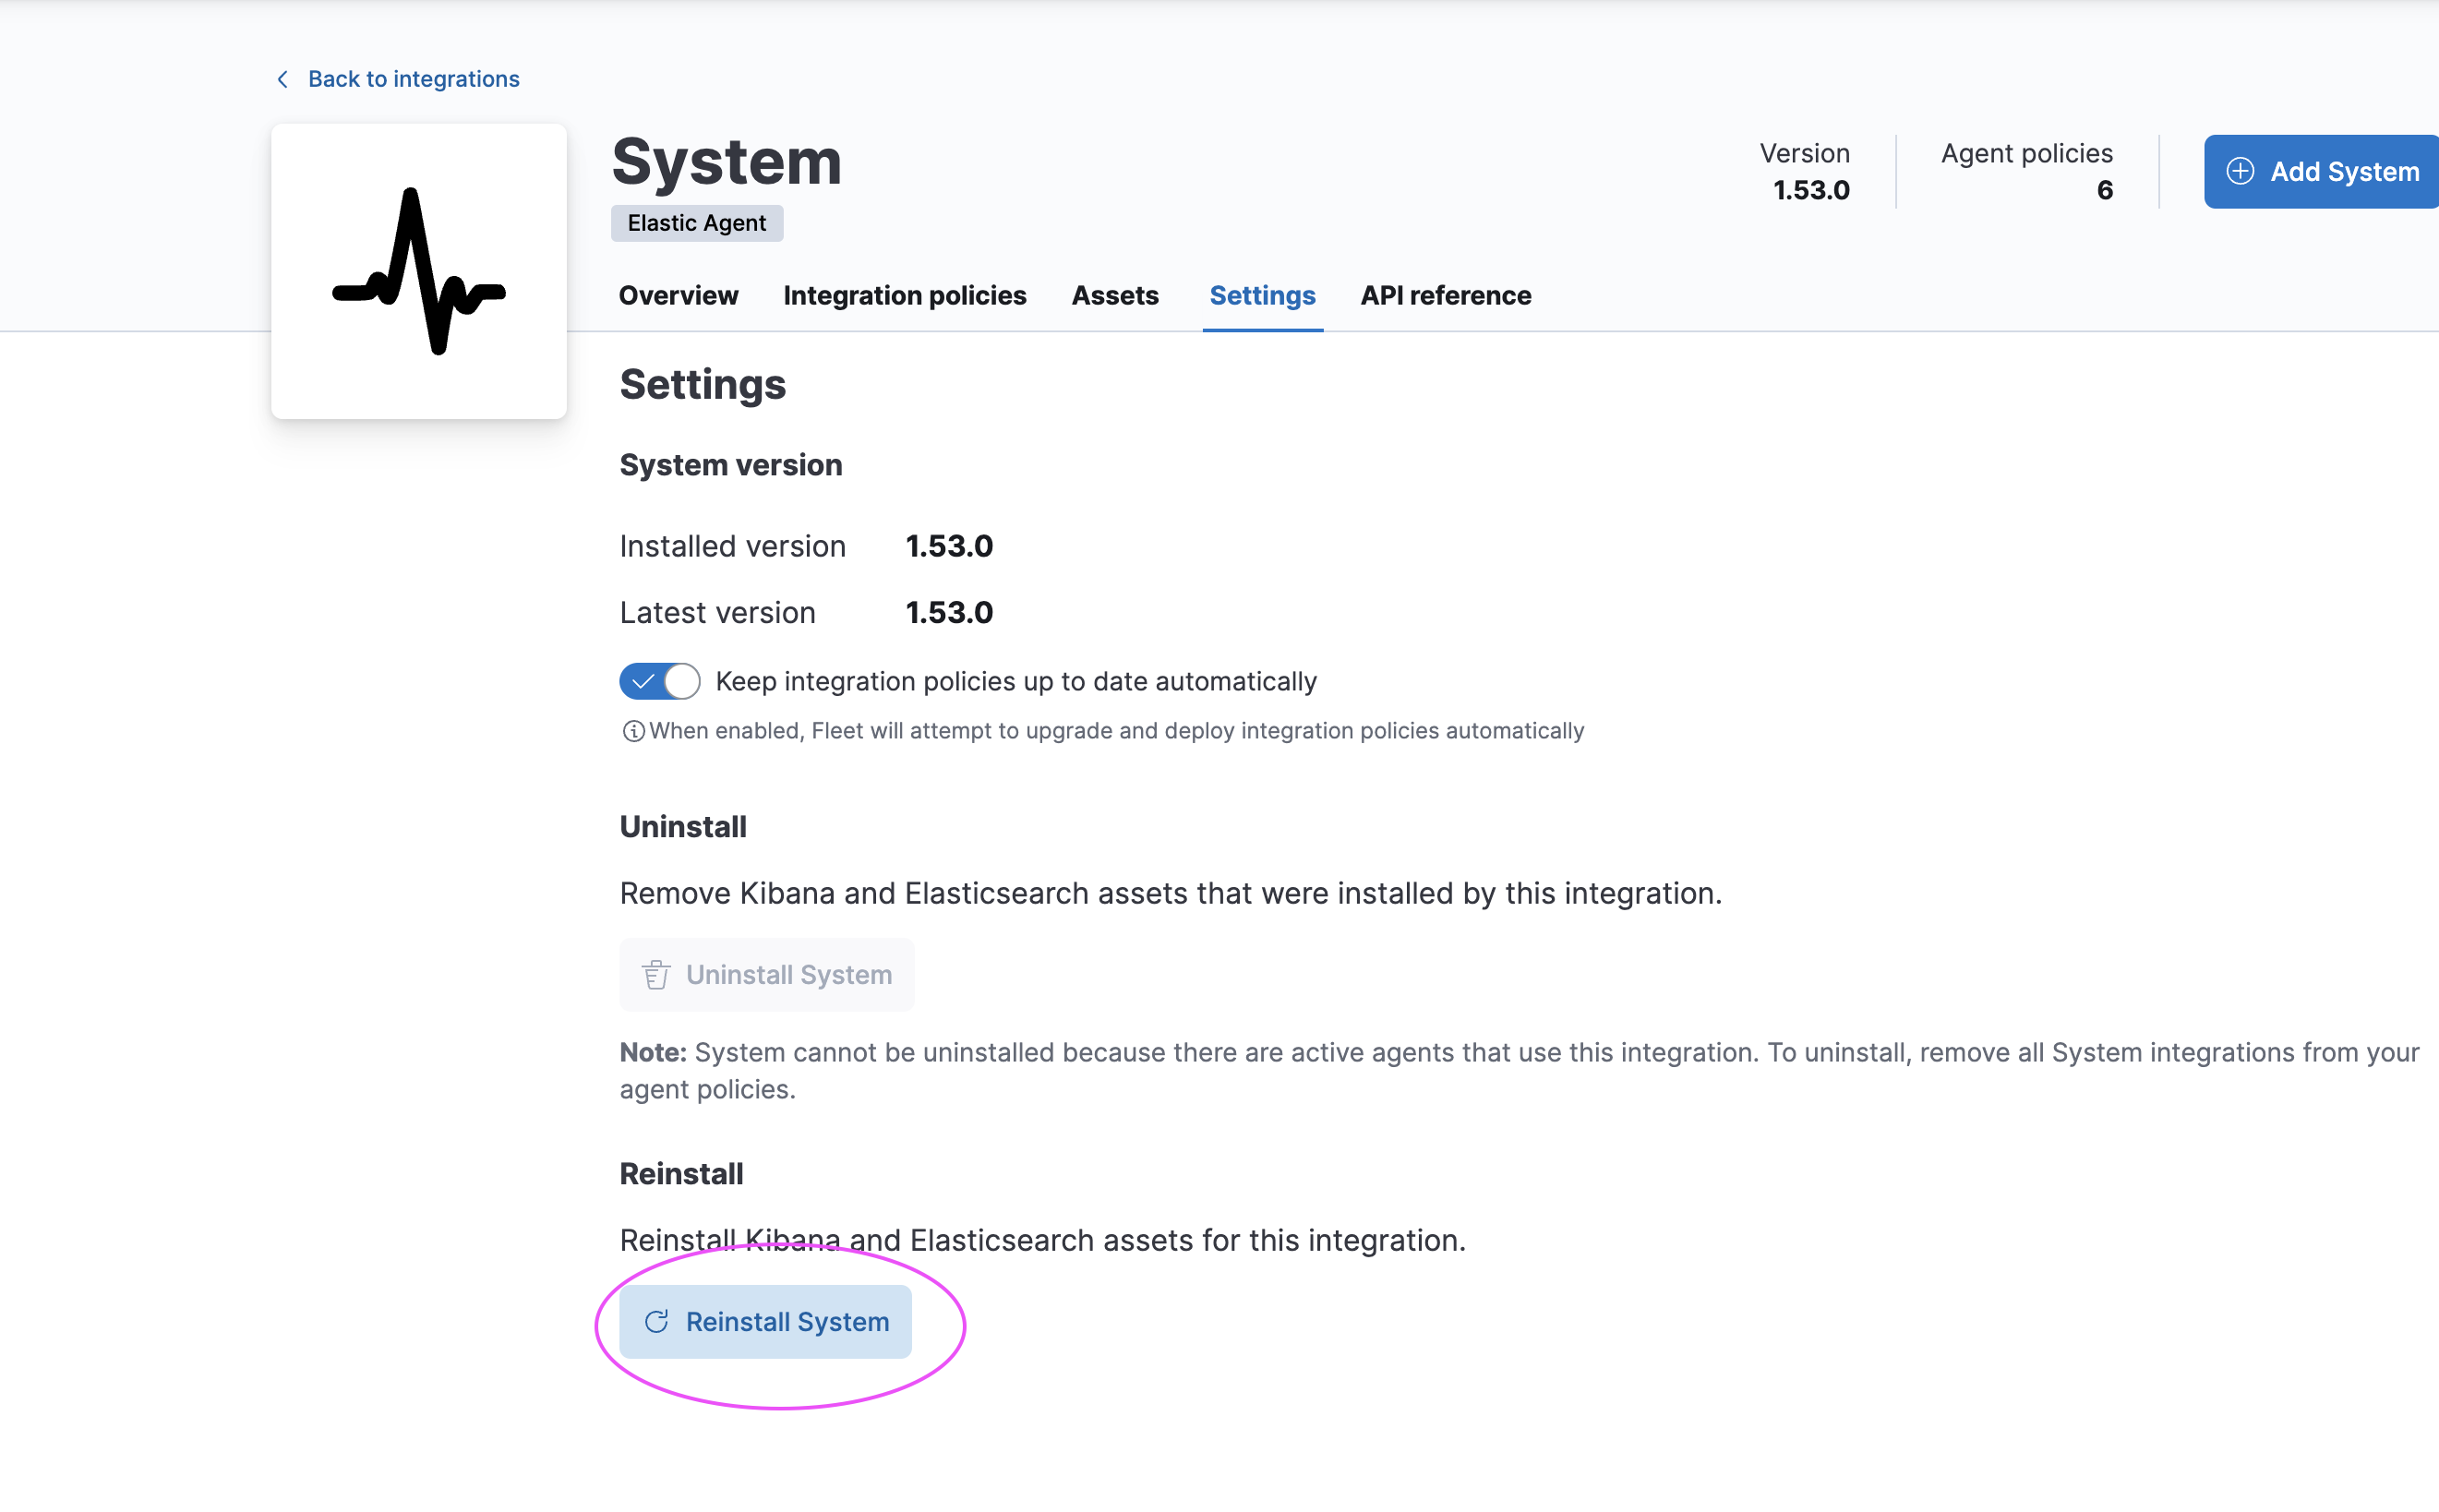
Try to go under setting and reload the assets... that is not good...

---
### Author:  [@Patr123](https://discuss.elastic.co/u/Patr123)
#### Post date: [January 18, 2024, 2:35am UTC](https://discuss.elastic.co/t/metrics-system-overview-dashboard-redirects-to-a-404-dashboard-not-found-page-in-kibana/351033/7 "2024-01-18T02:35:42Z")
I just did that and checked the assets tab but I got the same message about no assets found.

---
### Author:  [@stephenb](https://discuss.elastic.co/u/stephenb)
#### Post date: [January 18, 2024, 3:26am UTC](https://discuss.elastic.co/t/metrics-system-overview-dashboard-redirects-to-a-404-dashboard-not-found-page-in-kibana/351033/8 "2024-01-18T03:26:47Z")
Reload that page?
Are you elastic user?
Also so perhaps you are missing the port?
> server.publicBaseUrl
> The publicly available URL that end-users access Kibana at. Must include the protocol, hostname, port (if different than the defaults for http and https, 80 and 443 respectively), and the server.basePath (if configured). This setting cannot end in a slash (/).
---
### Author:  [@Patr123](https://discuss.elastic.co/u/Patr123)
#### Post date: [January 18, 2024, 3:58am UTC](https://discuss.elastic.co/t/metrics-system-overview-dashboard-redirects-to-a-404-dashboard-not-found-page-in-kibana/351033/9 "2024-01-18T03:58:38Z")
Yes, I did reload the page, but still the same thing.
I logged with the superuser credentials.
I didn't get what you meant by `Also so perhaps you are missing the port?`
---
### Author:  [@stephenb](https://discuss.elastic.co/u/stephenb)
#### Post date: [January 18, 2024, 4:58am UTC](https://discuss.elastic.co/t/metrics-system-overview-dashboard-redirects-to-a-404-dashboard-not-found-page-in-kibana/351033/10 "2024-01-18T04:58:37Z")
> [@stephenb](#):
>
> server.publicBaseUrl
The document says add the port to that settings... You did not.
But I am more concerned why the assets don't show.
---
### Author:  [@Patr123](https://discuss.elastic.co/u/Patr123)
#### Post date: [January 19, 2024, 2:22pm UTC](https://discuss.elastic.co/t/metrics-system-overview-dashboard-redirects-to-a-404-dashboard-not-found-page-in-kibana/351033/11 "2024-01-19T14:22:04Z")
Got it, I added that URL as I used to get a warning as soon as I logged into Kibana.
Also I checked my dev kibana instance and I do see the assets under system integration.
---
### Author:  [@system](https://discuss.elastic.co/u/system)
#### Post date: [February 16, 2024, 2:22pm UTC](https://discuss.elastic.co/t/metrics-system-overview-dashboard-redirects-to-a-404-dashboard-not-found-page-in-kibana/351033/12 "2024-02-16T14:22:12Z")
This topic was automatically closed 28 days after the last reply. New replies are no longer allowed.