# Missing JVM Metrics with Opentelemetry
**URL:** https://discuss.elastic.co/t/missing-jvm-metrics-with-opentelemetry/315099
**Category:** APM
**Tags:** java
**Created:** [September 25, 2022, 11:52am UTC](https://discuss.elastic.co/t/missing-jvm-metrics-with-opentelemetry/315099 "2022-09-25T11:52:07Z")
**Posts on this page:** 3
**Page:** 1
### Author:  [@zirota](https://discuss.elastic.co/u/zirota)
#### Post date: [September 25, 2022, 11:52am UTC](https://discuss.elastic.co/t/missing-jvm-metrics-with-opentelemetry/315099/1 "2022-09-25T11:52:07Z")
**Kibana version** : 8.3.3
**Elasticsearch version** : 8.3.3
**APM Server version** : 8.3.3
**Opentelemetry java agent** : 1.18.0
**Steps to reproduce** :
1. Setup Elasticsearch, Kibana & APM server 8.3.3
2. Setup Opentelemetry collector to export otlp to Elastic APM
3. Instrumented java application using opentelemetry-javaagent
4. Configure application to export oltp telemetry data to Opentelemetry collector
Hi, I have this setup going:
java application (otlp) -\> Opentelemetry Collector -\> Elastic APM
Everything looks fine from Kibana, however I am unable to view any JVM related metrics

I changed the java agent to the Elastic Java agent and exported the telemetry data directly into Elastic APM and it seemed to worked:
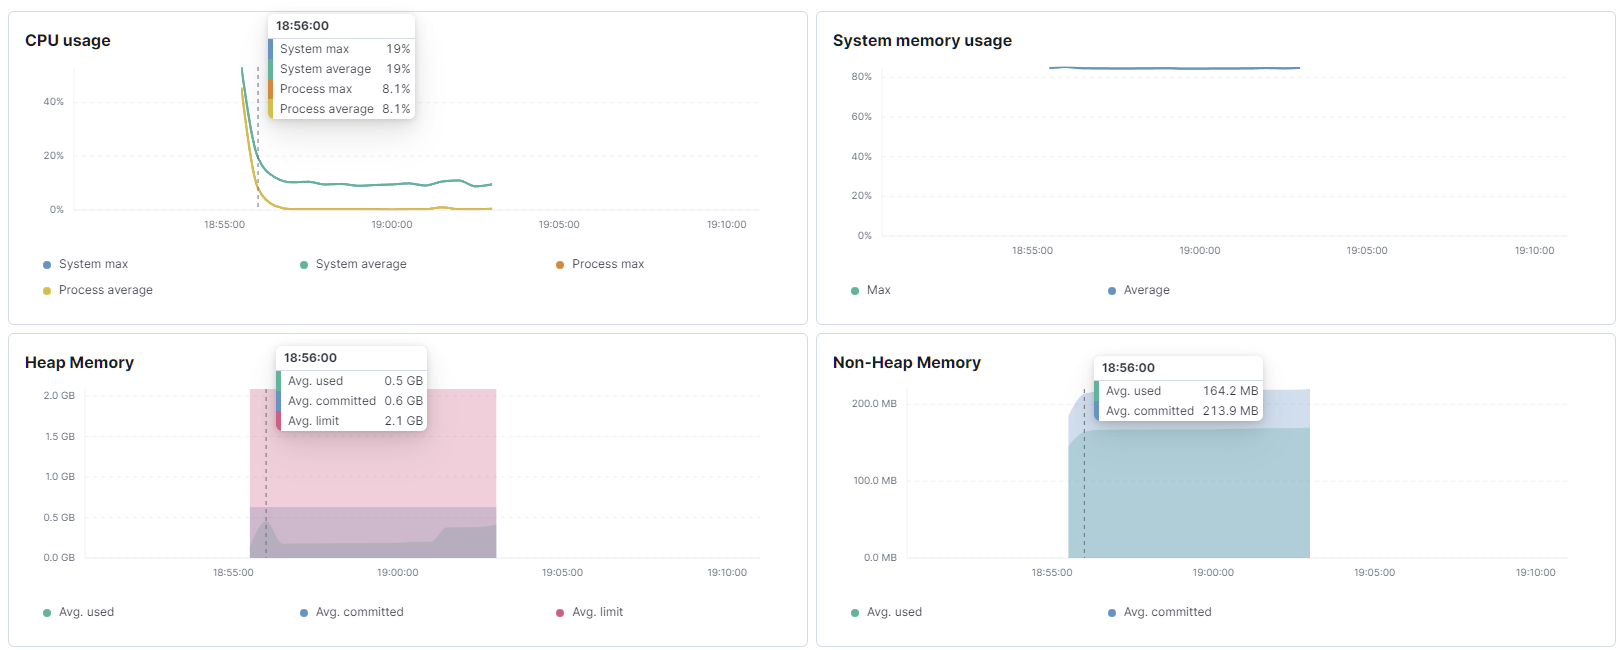
Does anyone know whether this is intended behavior for Opentelemetry exported metrics to not show in the JVM tab or is this something I can configure to get it supported?
---
### Author:  [@alexander.wert](https://discuss.elastic.co/u/alexander.wert)
#### Post date: [September 26, 2022, 10:52am UTC](https://discuss.elastic.co/t/missing-jvm-metrics-with-opentelemetry/315099/2 "2022-09-26T10:52:48Z")
Hi @zirota ,
OpenTelemetry changed the metrics format for JVMs at some point, that's why it is not working with OTel Java agent version 1.18 and Elastic Stack version 8.3.
This [has been fixed recently](https://github.com/elastic/apm-server/issues/8042) in the Elastic APM Server and should be available with the next release of the Elastic Stack.
---
### Author:  [@system](https://discuss.elastic.co/u/system)
#### Post date: [October 17, 2022, 6:53am UTC](https://discuss.elastic.co/t/missing-jvm-metrics-with-opentelemetry/315099/3 "2022-10-17T06:53:14Z")
This topic was automatically closed 20 days after the last reply. New replies are no longer allowed.