# Need help creating a status panel using Heartbeat data
**URL:** https://discuss.elastic.co/t/need-help-creating-a-status-panel-using-heartbeat-data/306170
**Category:** Kibana
**Created:** [June 1, 2022, 10:38pm UTC](https://discuss.elastic.co/t/need-help-creating-a-status-panel-using-heartbeat-data/306170 "2022-06-01T22:38:42Z")
**Posts on this page:** 8
**Page:** 1
### Author:  [@paolovalladolid](https://discuss.elastic.co/u/paolovalladolid)
#### Post date: [June 1, 2022, 10:38pm UTC](https://discuss.elastic.co/t/need-help-creating-a-status-panel-using-heartbeat-data/306170/1 "2022-06-01T22:38:42Z")
I am trying to partially recreate the example dashboard shown here:
> **[Heartbeat: Monitor Services with Elasticsearch | Elastic](https://www.elastic.co/beats/heartbeat)**
>
> Monitor the uptime and availability of services by centralizing that information in Elasticsearch for analysis and visualizing in Kibana.
In particular, I want to create a panel that uses a table, and I want the first column to be an up/down status column. This is the desired look:
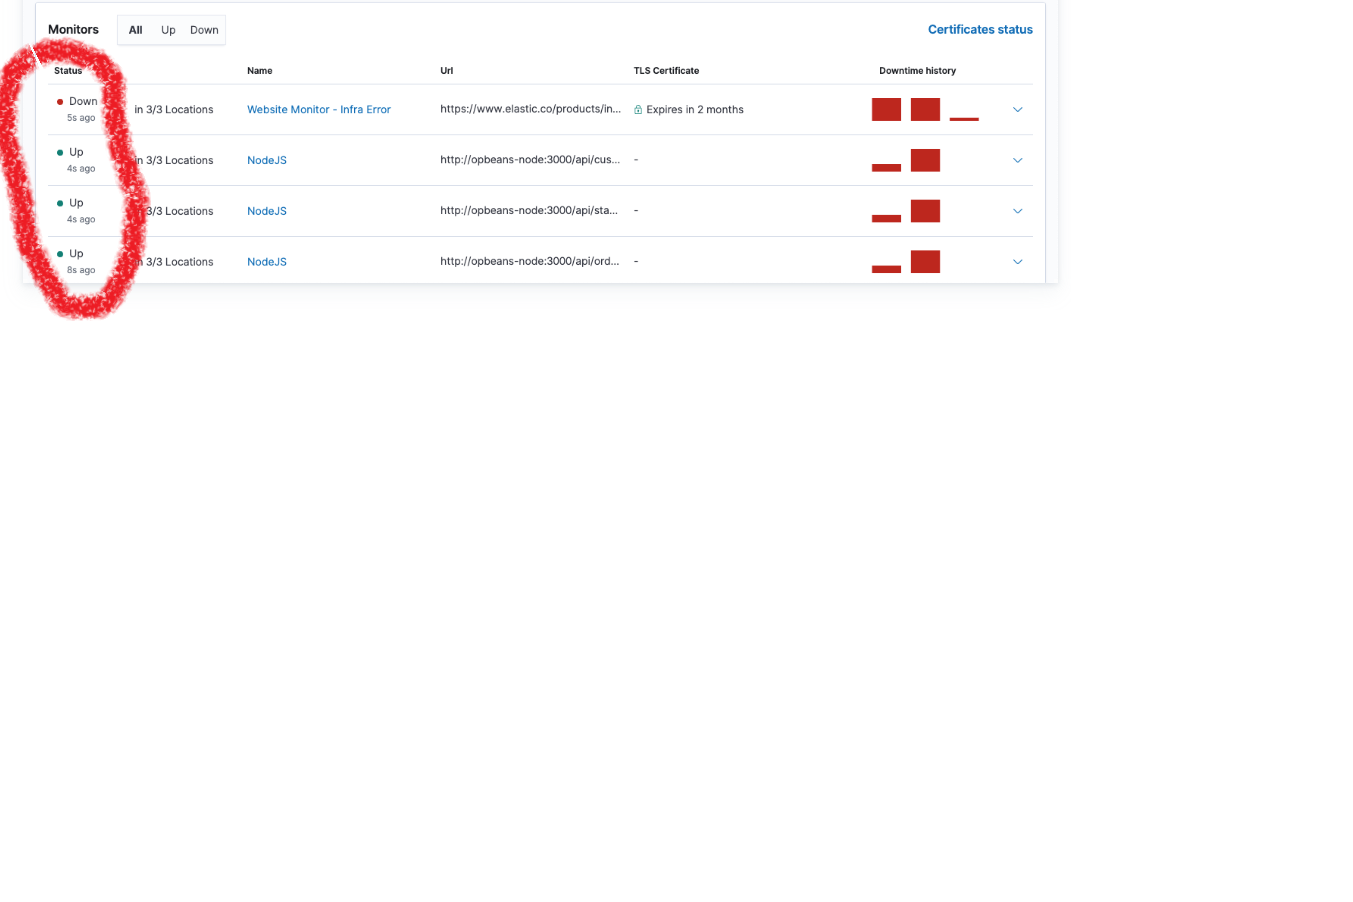
What I am getting instead is this

These are the table settings

---
### Author:  [@stephenb](https://discuss.elastic.co/u/stephenb)
#### Post date: [June 1, 2022, 11:09pm UTC](https://discuss.elastic.co/t/need-help-creating-a-status-panel-using-heartbeat-data/306170/2 "2022-06-01T23:09:20Z")
Use Lens -\> Table -\> Last Value

---
### Author:  [@paolovalladolid](https://discuss.elastic.co/u/paolovalladolid)
#### Post date: [June 1, 2022, 11:27pm UTC](https://discuss.elastic.co/t/need-help-creating-a-status-panel-using-heartbeat-data/306170/3 "2022-06-01T23:27:37Z")
Thanks! That hint helped a lot, as well as realizing I have to set Rows to url.domain.
How do I add the little red/green indicators next to the monitor status, as shown on the Heartbeat monitor example?
---
### Author:  [@stephenb](https://discuss.elastic.co/u/stephenb)
#### Post date: [June 2, 2022, 12:23am UTC](https://discuss.elastic.co/t/need-help-creating-a-status-panel-using-heartbeat-data/306170/4 "2022-06-02T00:23:06Z")
I don't think we have markup yet in the Kibana Lens Table Yet...
But with 5 Minutes work you can have it 🙂
First Create a runtime field based on the `monitor.status`
Here is the code
```auto
if (doc['monitor.status'].value == 'up')
{
emit(Integer.parseInt("1"));
}
else
{
emit(Integer.parseInt("0"));
}
```


Then add it as a metric


And set the colors

And Whullah ... not perfect but pretty close

Slightly Different Version (put space in label)

---
### Author:  [@paolovalladolid](https://discuss.elastic.co/u/paolovalladolid)
#### Post date: [June 2, 2022, 8:41pm UTC](https://discuss.elastic.co/t/need-help-creating-a-status-panel-using-heartbeat-data/306170/5 "2022-06-02T20:41:57Z")
> [@stephenb](#):
>
> ```auto
> if (doc['monitor.status'].value == 'up')
> {
> emit(Integer.parseInt("1"));
> }
> else
> {
> emit(Integer.parseInt("0"));
> }
>
> ```
Thanks! I think this will do fine for now.
---
### Author:  [@paolovalladolid](https://discuss.elastic.co/u/paolovalladolid)
#### Post date: [June 28, 2022, 6:21pm UTC](https://discuss.elastic.co/t/need-help-creating-a-status-panel-using-heartbeat-data/306170/6 "2022-06-28T18:21:04Z")
Hi again @stephenb,
Is is possible to add more than one drilldown to a Lens Table?
We have the URLs organized by environment (the typical dev, UAT (test), and production environments). So ideally clicking on certain URLs will take the user to the dev dashboard, clicking other URLs will take the user to the UAT dashboard, and so on.
---
### Author:  [@stephenb](https://discuss.elastic.co/u/stephenb)
#### Post date: [June 28, 2022, 6:51pm UTC](https://discuss.elastic.co/t/need-help-creating-a-status-panel-using-heartbeat-data/306170/7 "2022-06-28T18:51:32Z")
Yes! But I am not sure how you will filter / direct to the proper env from each row.
You could create 3 drill downs to different URLS but the would be available for every row... there is not if/then logic in the drill downs not sure exactly how to do it.
Maybe you could a different type like the context menu... and just set 3 dev, UAT, Prod etc.
You should play with it.. .let me know what you figure out!!
The drilldowns can use values from your table

Or 3 Links to Dashboards

---
### Author:  [@system](https://discuss.elastic.co/u/system)
#### Post date: [July 26, 2022, 6:51pm UTC](https://discuss.elastic.co/t/need-help-creating-a-status-panel-using-heartbeat-data/306170/8 "2022-07-26T18:51:58Z")
This topic was automatically closed 28 days after the last reply. New replies are no longer allowed.