# Need help in Kibana visualize graphs
**URL:** https://discuss.elastic.co/t/need-help-in-kibana-visualize-graphs/91041
**Category:** Kibana
**Created:** [June 28, 2017, 5:02am UTC](https://discuss.elastic.co/t/need-help-in-kibana-visualize-graphs/91041 "2017-06-28T05:02:25Z")
**Posts on this page:** 3
**Page:** 1
### Author:  [@vijjun123](https://discuss.elastic.co/u/vijjun123)
#### Post date: [June 28, 2017, 5:02am UTC](https://discuss.elastic.co/t/need-help-in-kibana-visualize-graphs/91041/1 "2017-06-28T05:02:25Z")
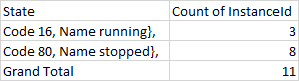
I am using kibana Version 4.6.4 and have data as per the below
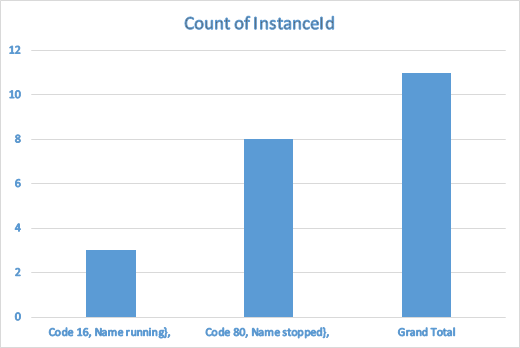
Looking for graph as per the below
Could you please let me know the solution.
State Count of Instance ID
Code 16, Name running}, 3
Code 80, Name stopped}, 8
Grand Total 11
ReservationId InstanceId State
r-01782 i-0206 Code 80, Name stopped},
87c4ec7e40df i-067e Code 16, Name running},
50e16fcf23e1 i-09c2 Code 80, Name stopped},
741e91dc01a5 i-01d2 Code 16, Name running},
763507a1c514 i-08e5 Code 80, Name stopped},
b45b558199a3 i-06a6 Code 80, Name stopped},
6df7f6f50185 i-0727 Code 80, Name stopped},
124aa8ed20a7 i-089b Code 16, Name running},
165e11962bca i-04e9 Code 80, Name stopped},
229725be22a6 i-0c73 Code 80, Name stopped},
0ff8477a8e4d i-06b6 Code 80, Name stopped},
State Count of InstanceId
Code 16, Name running}, 3
Code 80, Name stopped}, 8
Grand Total 11
---
### Author:  [@Marius\_Dragomir](https://discuss.elastic.co/u/Marius_Dragomir)
#### Post date: [June 28, 2017, 12:16pm UTC](https://discuss.elastic.co/t/need-help-in-kibana-visualize-graphs/91041/2 "2017-06-28T12:16:56Z")
I don;t really understand the question.
How does an indexed document look for you? (in Discover, for example)
Also, if you want to achieve that visualization, it's not really possible to make one like that, but you can do a stacked one, where one bar color represents Code 16, another one Code80 and the total bar height represents the Total.

---
### Author:  [@system](https://discuss.elastic.co/u/system)
#### Post date: [July 26, 2017, 12:16pm UTC](https://discuss.elastic.co/t/need-help-in-kibana-visualize-graphs/91041/3 "2017-07-26T12:16:58Z")
This topic was automatically closed 28 days after the last reply. New replies are no longer allowed.