# One line per year with monthly buckets in line chart
**URL:** https://discuss.elastic.co/t/one-line-per-year-with-monthly-buckets-in-line-chart/321294
**Category:** Kibana
**Created:** [December 15, 2022, 11:08am UTC](https://discuss.elastic.co/t/one-line-per-year-with-monthly-buckets-in-line-chart/321294 "2022-12-15T11:08:42Z")
**Posts on this page:** 15
**Page:** 1
### Author:  [@Jonas\_S](https://discuss.elastic.co/u/Jonas_S)
#### Post date: [December 15, 2022, 11:08am UTC](https://discuss.elastic.co/t/one-line-per-year-with-monthly-buckets-in-line-chart/321294/1 "2022-12-15T11:08:42Z")
Hello,
i have a line chart with a date histogram with monthly buckets on the horizontal axis. And a proportion of two cumulative sums on the vertical axis.

Is there a way to overlay all years to have only a single year on the horizontal axis but then one line per year for the proportion. I don't know how to do it because of the cumulative sum requiring the date histogram.
Best regards
Jonas
---
### Author:  [@dadiasish](https://discuss.elastic.co/u/dadiasish)
#### Post date: [December 15, 2022, 11:20am UTC](https://discuss.elastic.co/t/one-line-per-year-with-monthly-buckets-in-line-chart/321294/2 "2022-12-15T11:20:28Z")
One simple way is to create two different Visualizations and add it together in a Dashboard side by side, if that works out for you.
---
### Author:  [@Jonas\_S](https://discuss.elastic.co/u/Jonas_S)
#### Post date: [December 15, 2022, 11:40am UTC](https://discuss.elastic.co/t/one-line-per-year-with-monthly-buckets-in-line-chart/321294/3 "2022-12-15T11:40:06Z")
Thanks, but i can't create 17 visualizations side by side. Also new data is coming in monthly so i would need to create another visualization every year.
I saw that with tsvb it is possible to offset a series. So i could create a series per year and offset each one by an additional year, but then i would have to create a new series every year from now on and i would like to avoid that.
I'm looking for a way to automatically split by year so from now on a new line is created every year and gets a new datapoint every month.
---
### Author:  [@Marco\_Liberati](https://discuss.elastic.co/u/Marco_Liberati)
#### Post date: [December 15, 2022, 11:47am UTC](https://discuss.elastic.co/t/one-line-per-year-with-monthly-buckets-in-line-chart/321294/4 "2022-12-15T11:47:56Z")
Hi @Jonas_S
have you considered using the time\_shift option?
Is still a manual job to create a new dimension per year, but way quicker than creating a panel per year.
Here I have a formula function using `cumulative_sum` and I'm duplicating it replacing the `shift` option:

---
### Author:  [@Jonas\_S](https://discuss.elastic.co/u/Jonas_S)
#### Post date: [December 15, 2022, 12:02pm UTC](https://discuss.elastic.co/t/one-line-per-year-with-monthly-buckets-in-line-chart/321294/5 "2022-12-15T12:02:29Z")
Thanks for the suggestion. That sounds already pretty close to what i want.
But i'm not sure how to do it. If i add the shift to the two sums, no line is drawn:

---
### Author:  [@Marco\_Liberati](https://discuss.elastic.co/u/Marco_Liberati)
#### Post date: [December 15, 2022, 12:19pm UTC](https://discuss.elastic.co/t/one-line-per-year-with-monthly-buckets-in-line-chart/321294/6 "2022-12-15T12:19:42Z")
I see there's a warning sign in there (yellow marks). I suspect you have to tweak a bit the date histogram interval in order to align the shift with it (the shift has to be a multiple of the interval): can you try to force the date\_histogram interval to `Month`?
---
### Author:  [@Jonas\_S](https://discuss.elastic.co/u/Jonas_S)
#### Post date: [December 15, 2022, 12:38pm UTC](https://discuss.elastic.co/t/one-line-per-year-with-monthly-buckets-in-line-chart/321294/7 "2022-12-15T12:38:07Z")
I think it already is Month, no? Is there another setting despite Minimum interval?

The warnings:

The warning persists even with 12M. It only goes away with 1M, but even then, no line is drawn:

---
### Author:  [@Jonas\_S](https://discuss.elastic.co/u/Jonas_S)
#### Post date: [December 15, 2022, 1:20pm UTC](https://discuss.elastic.co/t/one-line-per-year-with-monthly-buckets-in-line-chart/321294/8 "2022-12-15T13:20:55Z")
Could it be, that shift always looks at @timestamp? I'm using my own date field for the date histogram.
All documents have the same @timestamp, because i just created the index today. If i use a shift \< @timestamp, i get the same as without the shift. If i use a shift \> @timestamp no results are shown.
How can i tell the shift, that my own date field is the field to be shifted by and not @timestamp?
---
### Author:  [@Marco\_Liberati](https://discuss.elastic.co/u/Marco_Liberati)
#### Post date: [December 15, 2022, 1:46pm UTC](https://discuss.elastic.co/t/one-line-per-year-with-monthly-buckets-in-line-chart/321294/9 "2022-12-15T13:46:18Z")
It should use the field selected in the `date_histogram` configuration.
You can check it in the Inspector, looking at the Request sent over to Elasticsearch:
```auto
...
"filters": {
"0": { // current time
"range": {
"": {
"format": "strict_date_optional_time",
"gte": "2022-12-14T13:00:00.000Z",
"lte": "2022-12-15T13:44:32.283Z"
}
}
},
"31536000000": { // time shift
"range": {
"": {
"format": "strict_date_optional_time",
"gte": "2021-12-14T13:00:00.000Z",
"lte": "2021-12-15T13:44:32.283Z"
}
}
}
...
```
---
### Author:  [@Jonas\_S](https://discuss.elastic.co/u/Jonas_S)
#### Post date: [December 15, 2022, 2:32pm UTC](https://discuss.elastic.co/t/one-line-per-year-with-monthly-buckets-in-line-chart/321294/10 "2022-12-15T14:32:48Z")
Ah, yes, i found the problem. It only works if i check "bind to global time picker". But if i do that, i have to select last 1 year in order to get the section of the diagram i want.
But there are other visualizations in the dashboard that get filtered by a control for year. And if the global time picker is set to last 1 year i would only be able to display that data in the other visualizations.
---
### Author:  [@Marco\_Liberati](https://discuss.elastic.co/u/Marco_Liberati)
#### Post date: [December 15, 2022, 2:36pm UTC](https://discuss.elastic.co/t/one-line-per-year-with-monthly-buckets-in-line-chart/321294/11 "2022-12-15T14:36:35Z")
You can still pin filters for the specific visualization panel in dashboard
---
### Author:  [@Jonas\_S](https://discuss.elastic.co/u/Jonas_S)
#### Post date: [December 15, 2022, 3:19pm UTC](https://discuss.elastic.co/t/one-line-per-year-with-monthly-buckets-in-line-chart/321294/12 "2022-12-15T15:19:16Z")
What?
So i use my own date field as Timestamp field in the Data View:

Then i create the visualization with the shift:

First problem:
If i set the global time picker to something smaller than the full range, the blue line is no longer just shifted to the side, but also downward and scaled somehow.

And even if that was not the case, if i set it to 1 year, the control element only gives 1 year as filter option.

But i want to be able to filter a table with this by year. So i have to set it to the full range.

If i now select a year, the graph should either show just the line of the filtered year or all lines so the user can manually filter. But what it actually does is show just the data from that year over the full range

As an alternative, i can use no timestamp field in the data view, but then shift can't be used at all.
So the last thing is to use @timestamp as timestamp field in the data view and select "bind to global time picker"
So now i can again set the global time picker to last 1 year to get the desired section in the graph.

Again, it's shifted and scaled, but that's another problem.
And now i can also select the years in the control and filter the table with it. But of course this also filters the graph and it shows no more data. Again i would need either all lines or the line of the filter.

And the next thing is, in a year from now documents will have a timestamp to old to be included.
So i guess what i want to do is just not possible at the moment. (A dashboard with a table that can be filtered by year and a line chart showing either the line from that filtered year or all lines in an interval of 1 year)
---
### Author:  [@Jonas\_S](https://discuss.elastic.co/u/Jonas_S)
#### Post date: [December 15, 2022, 3:41pm UTC](https://discuss.elastic.co/t/one-line-per-year-with-monthly-buckets-in-line-chart/321294/13 "2022-12-15T15:41:33Z")
I saw that with TSVB it is possible to ignore global filters, but i wasn't able to divide two cumulative sums on the same field with different filters, because the filter can only be set here:

But my formula requires different filters for "stunden" for the two sums
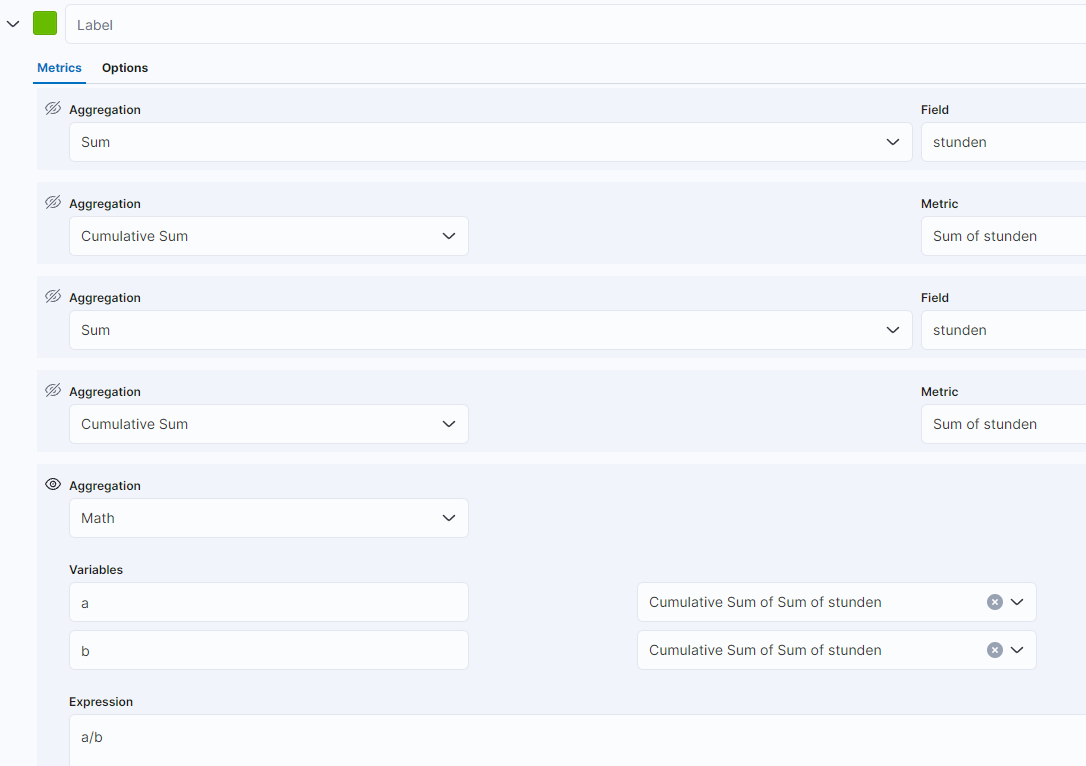

No idea how to set the first kql on the first field and the second kql on the second field, if there is only a general filter option.
---
### Author:  [@Jonas\_S](https://discuss.elastic.co/u/Jonas_S)
#### Post date: [December 15, 2022, 5:41pm UTC](https://discuss.elastic.co/t/one-line-per-year-with-monthly-buckets-in-line-chart/321294/14 "2022-12-15T17:41:47Z")
So in the end i was pretty annoyed, so i just unioned the whole sql two times with itself, shifted by one and two years and gave it an extra flag to filter the records. So now just the current year and the last two ones are availabe, but i don't have to bother with this weird shifting behaviour that is tied to the time picker. So i can filter by year with the control element and just get the 1 year section with the current and last two years each as extra line.


---
### Author:  [@system](https://discuss.elastic.co/u/system)
#### Post date: [January 12, 2023, 5:41pm UTC](https://discuss.elastic.co/t/one-line-per-year-with-monthly-buckets-in-line-chart/321294/15 "2023-01-12T17:41:51Z")
This topic was automatically closed 28 days after the last reply. New replies are no longer allowed.