# Ordering Gauge Visualisation
**URL:** https://discuss.elastic.co/t/ordering-gauge-visualisation/345690
**Category:** Kibana
**Created:** [October 25, 2023, 4:01am UTC](https://discuss.elastic.co/t/ordering-gauge-visualisation/345690 "2023-10-25T04:01:59Z")
**Posts on this page:** 4
**Page:** 1
### Author:  [@Ric\_UTS](https://discuss.elastic.co/u/Ric_UTS)
#### Post date: [October 25, 2023, 4:01am UTC](https://discuss.elastic.co/t/ordering-gauge-visualisation/345690/1 "2023-10-25T04:01:59Z")
Hello. I have been trying to create a gauge-based dashboard visualisation but it appears that I am unable to oder it, either by count or by the metric keyword.
Please see attached image. I would have preferred it to be in descending order by hits.
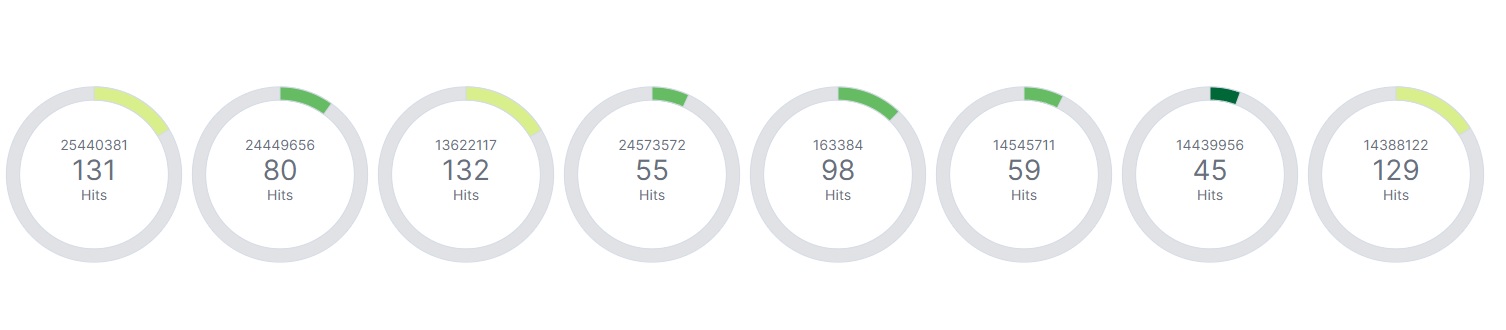
Any help would be appreciated. Thanks.
---
### Author:  [@jsanz](https://discuss.elastic.co/u/jsanz)
#### Post date: [October 26, 2023, 1:47pm UTC](https://discuss.elastic.co/t/ordering-gauge-visualisation/345690/2 "2023-10-26T13:47:01Z")
Not sure how are you setting up that chart, but both in Lens and the legacy aggregated visualizations you can order break down by the metric or the alphabetical value of the condition to break the values
On this Lens chart of the eCommerce sample dataset, the metric type is rendering the average of `products.base.unit_price` break down by `geoip.continent_name`.
I can order the charts by the metric (average of the price) or by the continent name (I can even use a custom criteria).

---
### Author:  [@Ric\_UTS](https://discuss.elastic.co/u/Ric_UTS)
#### Post date: [October 27, 2023, 1:30am UTC](https://discuss.elastic.co/t/ordering-gauge-visualisation/345690/3 "2023-10-27T01:30:15Z")
Hello Jorge,
There is no option whatsoever on the gauge type. You showed a different chart which is why you have those options. On other chart types, such as bar graph, I can easily order by count. On the gauge type, however, I cannot see where that option is. I may be missing it, but I do not see any control with which to set the order. Maybe I'm creating the visualisation in the incorrect order perhaps? I am new to this so please bear with me. Thanks.
---
### Author:  [@system](https://discuss.elastic.co/u/system)
#### Post date: [November 24, 2023, 1:31am UTC](https://discuss.elastic.co/t/ordering-gauge-visualisation/345690/4 "2023-11-24T01:31:11Z")
This topic was automatically closed 28 days after the last reply. New replies are no longer allowed.