# Row encoding and autosize makes chart not appear
**URL:** https://discuss.elastic.co/t/row-encoding-and-autosize-makes-chart-not-appear/274229
**Category:** Kibana
**Tags:** vega
**Created:** [May 27, 2021, 2:52pm UTC](https://discuss.elastic.co/t/row-encoding-and-autosize-makes-chart-not-appear/274229 "2021-05-27T14:52:59Z")
**Posts on this page:** 6
**Page:** 1
### Author:  [@es\_net](https://discuss.elastic.co/u/es_net)
#### Post date: [May 27, 2021, 2:52pm UTC](https://discuss.elastic.co/t/row-encoding-and-autosize-makes-chart-not-appear/274229/1 "2021-05-27T14:52:59Z")
Hi, I am attempting to make charts similar to [Faceting a Plot into a Trellis Plot | Vega-Lite](https://vega.github.io/vega-lite/docs/facet.html#row-encoding) with multiple rows of charts, split using the row encoding.
(The link above should go to the section titled ' Row Facet (with Row Encoding)')
I don't want the chart to autosize, so have added _autosize: none_ and _height: 200_ and _width: 200_.
However, then no chart appears, and in the debug it shows height and width as -10, with child\_height and child\_width at 200.

If I remove the row section it does work to resize the chart to 200x200.

Similarly if I remove autosize/height/width the chart renders multiple (v. large) charts in a row.
Vega spec (URL section removed as it contained data I can't share - the data request works fine):
```auto
{
"$schema": "https://vega.github.io/schema/vega-lite/v4.json",
"autosize": {
"type": "none",
"contains": "padding"
},
"height": 200,
"width": 200,
"data": {
"format": {
"property": "aggregations.time_buckets.buckets"
},
"url": {},
"values": {
"took": 4,
"timed_out": false,
"_shards": {
"total": 1,
"successful": 1,
"skipped": 0,
"failed": 0
},
"hits": {
"total": 6316,
"max_score": null,
"hits": []
},
"aggregations": {
"time_buckets": {
"buckets": [
{
"key_as_string": "1614556800",
"key": 1614556800000,
"doc_count": 3540,
"alarms": {
"value": 0
},
"cols": {
"buckets": {
"incident": {
"doc_count": 2506
},
"servicerequest": {
"doc_count": 942
}
}
}
},
{
"key_as_string": "1617235200",
"key": 1617235200000,
"doc_count": 2682,
"alarms": {
"value": 0
},
"cols": {
"buckets": {
"incident": {
"doc_count": 1879
},
"servicerequest": {
"doc_count": 728
}
}
}
},
{
"key_as_string": "1619827200",
"key": 1619827200000,
"doc_count": 94,
"alarms": {
"value": 38523
},
"cols": {
"buckets": {
"incident": {
"doc_count": 0
},
"servicerequest": {
"doc_count": 0
}
}
}
}
]
}
}
}
},
"transform": [
{
"calculate": "datum.cols.buckets.incident.doc_count",
"as": "Incident"
},
{
"calculate": "datum.cols.buckets.servicerequest.doc_count",
"as": "Service Request"
},
{
"calculate": "datum.alarms.value",
"as": "Alarms"
},
{
"calculate": "datum.key",
"as": "Date"
},
{
"fold": [
"Alarms",
"Incident",
"Service Request"
]
}
],
"encoding": {
"y": {
"field": "key",
"type": "nominal"
},
"x": {
"field": "value",
"type": "quantitative"
},
"color": {
"field": "key",
"type": "nominal"
},
"row": {
"field": "Date",
"type": "ordinal",
"timeUnit": "monthyear"
}
},
"mark": "bar",
"resolve": {
"axis": {
"x": "independent"
}
},
"config": {
"range": {
"category": {
"scheme": "elastic"
}
},
"mark": {
"color": "#54B399"
},
"title": {
"color": "#343741"
},
"style": {
"guide-label": {
"fill": "#69707d"
},
"guide-title": {
"fill": "#343741"
},
"group-title": {
"fill": "#343741"
},
"group-subtitle": {
"fill": "#343741"
}
},
"axis": {
"tickColor": "#eef0f3",
"domainColor": "#eef0f3",
"gridColor": "#eef0f3"
},
"background": "transparent"
}
}
```
Here's the data after transform
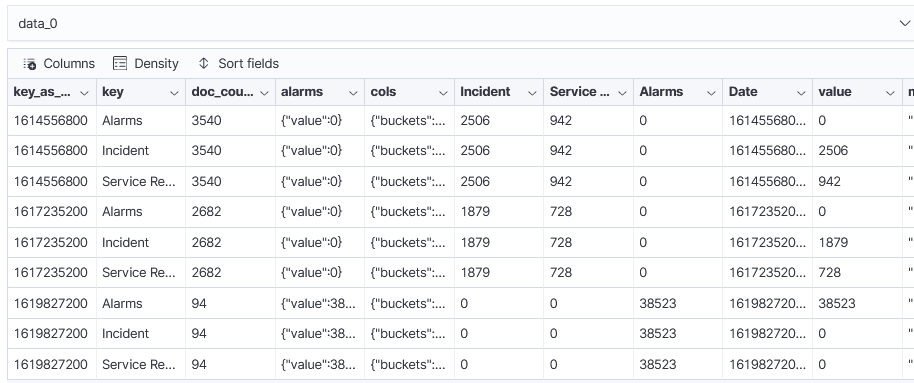
Please let me know if there's any other info from the debug that is useful here.
Thanks!
---
### Author:  [@Stratoula\_Kalafateli](https://discuss.elastic.co/u/Stratoula_Kalafateli)
#### Post date: [May 31, 2021, 9:40am UTC](https://discuss.elastic.co/t/row-encoding-and-autosize-makes-chart-not-appear/274229/2 "2021-05-31T09:40:27Z")
Hey @es_net!
From the documentation I can see that
```auto
The width and height of multi-view displays including concatenated, faceted, and repeated are determined based on the size of the composed unit and layered views. To adjust the size of multi-view displays, you can set the width and height properties of the inner unit and layered views
```
Have you tried this?
> **[Customizing Size](https://vega.github.io/vega-lite/docs/size.html#width-and-height-of-multi-view-displays)**
>
> Vega-Lite - a high-level grammar for statistical graphics. Vega-Lite provides a higher-level grammar for visual analysis, comparable to ggplot or Tableau, that generates complete Vega specifications. Vega-Lite specifications consist of simple...
---
### Author:  [@es\_net](https://discuss.elastic.co/u/es_net)
#### Post date: [June 1, 2021, 7:33am UTC](https://discuss.elastic.co/t/row-encoding-and-autosize-makes-chart-not-appear/274229/3 "2021-06-01T07:33:40Z")
Hi, thanks for the help. I am unsure where that would be set when using the row function.
I have tried setting it inside the row function i.e:
```auto
row:{
field: Date
type: ordinal
timeUnit: monthyear
height: 150
width: 300
}
```
However, the results were the same as the original signal values above.
Looking at [this example from the docs](https://vega.github.io/editor/#/url/vega-lite/N4IgJAzgxgFgpgWwIYgFwhgF0wBwqgegIDc4BzJAOjIEtMYBXAI0poHsDp5kTykBaADZ04JAKyUAVhDYA7EABoQAdxoATemgDsYpfBpks23SDVJMKVKAYAnQWlPmkBBG2I04EKTPkBfJcg2ANYOOGw0spiKIHCyUGxqEWRooPGCDAjyViAAZh6Cag4AsgAKAIJlAAQASuZJIP4gAB4pufmF6ADqbHZqqmpwlQDiNmwQENGYAJ44cA4AjgxIkXR1pA1KU615cAUOAKoAypUAIgBqJ5WHSIKekzNz6IvLmKuv676fQA) the width/height are set within the base document (unsure of a better way to describe that) and within the signal values the main width/height are 0, while the child values are set to those set in the document.
This is similar to what I'm seeing except that my width/height are ending up at -10.
---
### Author:  [@Stratoula\_Kalafateli](https://discuss.elastic.co/u/Stratoula_Kalafateli)
#### Post date: [June 1, 2021, 9:57am UTC](https://discuss.elastic.co/t/row-encoding-and-autosize-makes-chart-not-appear/274229/4 "2021-06-01T09:57:22Z")
Here is an example:
```auto
{
"$schema": "https://vega.github.io/schema/vega-lite/v5.json",
"title": "Event counts from all indexes",
config: {
kibana: {
hideWarnings: true
}
},
"data": {
"url": {
"%context%": true,
"%timefield%": "@timestamp",
"index": "kibana_sample_data_logs",
"body": {
"aggs": {
"time_buckets": {
"date_histogram": {
"field": "@timestamp",
"interval": {"%autointerval%": true},
"extended_bounds": {
"min": {"%timefilter%": "min"},
"max": {"%timefilter%": "max"}
},
"min_doc_count": 0
}
}
},
"size": 0
}
},
"format": {"property": "aggregations.time_buckets.buckets"}
},
"facet": {"row": {"field": "doc_count"}},
"spec": {
"mark": "bar",
"encoding": {
"x": {"field": "key", "type": "temporal", "axis": {"title": false}},
"y": {
"field": "doc_count",
"type": "quantitative",
"axis": {"title": "Document count"}
}
}
}
}
```

I think that you can adapt it to your needs.
---
### Author:  [@es\_net](https://discuss.elastic.co/u/es_net)
#### Post date: [June 1, 2021, 10:39am UTC](https://discuss.elastic.co/t/row-encoding-and-autosize-makes-chart-not-appear/274229/5 "2021-06-01T10:39:12Z")
Hi, I appreciate the example. That did help me transform the spec to my needs. For reference, this is the relevant bit of my spec now:
```auto
facet: {row: {field: "Date", type:"Ordinal", timeUnit:"monthyear"}},
spec: {
height: 150
width: 500
encoding: {
y: {
field: key
type: nominal
}
x: {
field: value
type: quantitative
},
color:{
"field": "key", "type":"nominal"
}
}
mark: bar
}
```
The kibana hideWarnings item is also required as it throws the warning for autosize/height/width but still works.
```auto
config: {kibana: {hideWarnings: true}}
```

I appreciate your help!
---
### Author:  [@system](https://discuss.elastic.co/u/system)
#### Post date: [June 29, 2021, 10:39am UTC](https://discuss.elastic.co/t/row-encoding-and-autosize-makes-chart-not-appear/274229/6 "2021-06-29T10:39:17Z")
This topic was automatically closed 28 days after the last reply. New replies are no longer allowed.