# Saved "field" parameter is now invalid. Please select a new field. .... Visualize: "field" is a required parameter
**URL:** https://discuss.elastic.co/t/saved-field-parameter-is-now-invalid-please-select-a-new-field-visualize-field-is-a-required-parameter/70034
**Category:** Kibana
**Created:** [December 27, 2016, 5:13am UTC](https://discuss.elastic.co/t/saved-field-parameter-is-now-invalid-please-select-a-new-field-visualize-field-is-a-required-parameter/70034 "2016-12-27T05:13:44Z")
**Posts on this page:** 20
**Page:** 1
### Author:  [@prakash1243](https://discuss.elastic.co/u/prakash1243)
#### Post date: [December 27, 2016, 5:13am UTC](https://discuss.elastic.co/t/saved-field-parameter-is-now-invalid-please-select-a-new-field-visualize-field-is-a-required-parameter/70034/1 "2016-12-27T05:13:44Z")
Hi-
Am running Elastic Search, Kibana with 5.1.1 version with X-Pack installed.
I started Metric beats service and running fine, sending data to Kibana dashboard as expected.
When I try to open the dashboard, Am getting a couple of warnings on top (like as the subject)
And I don't see any data on Metricbeat CPU details or Overview, I had attached the screenshot. 
Please help in resolving the issue. Thanks in advance.
---
### Author:  [@prakash1243](https://discuss.elastic.co/u/prakash1243)
#### Post date: [December 27, 2016, 8:06am UTC](https://discuss.elastic.co/t/saved-field-parameter-is-now-invalid-please-select-a-new-field-visualize-field-is-a-required-parameter/70034/2 "2016-12-27T08:06:33Z")
By the way, It happens only when we click on Overview Tab, Load CPU, CPU/Memory Per Container. And other tabs gets the data as expected.
Please let me know, how could I resolve the issue. Thanks !
---
### Author:  [@Stacey\_Gammon](https://discuss.elastic.co/u/Stacey_Gammon)
#### Post date: [December 27, 2016, 8:34pm UTC](https://discuss.elastic.co/t/saved-field-parameter-is-now-invalid-please-select-a-new-field-visualize-field-is-a-required-parameter/70034/3 "2016-12-27T20:34:52Z")
Interesting. I've seen a similar issue with packetbeat dashboards (see [this issue](https://github.com/elastic/kibana/issues/9571)), though I can't reproduce the error when I try with 5.1.1 using the metricbeat import\_dashboards script.
If you go into `Management` and refresh your Index Pattern's field list (click the orange button with two arrows in a circle), does this help? Doing that should fill in some field types, which is a possible reason for the issue. Just be aware that doing so will reset the popularity counters on your fields.
---
### Author:  [@prakash1243](https://discuss.elastic.co/u/prakash1243)
#### Post date: [December 28, 2016, 9:11am UTC](https://discuss.elastic.co/t/saved-field-parameter-is-now-invalid-please-select-a-new-field-visualize-field-is-a-required-parameter/70034/4 "2016-12-28T09:11:10Z")
Thanks for your reply.
I did refresh the Index Patterns and tried accessing the Dashboard Page, but Still I see the same issue. And important note is I don't see any data on the tabs.

Any other work around to eliminate this issue? Please let me know. Thanks in advance !!
---
### Author:  [@prakash1243](https://discuss.elastic.co/u/prakash1243)
#### Post date: [December 28, 2016, 9:19am UTC](https://discuss.elastic.co/t/saved-field-parameter-is-now-invalid-please-select-a-new-field-visualize-field-is-a-required-parameter/70034/5 "2016-12-28T09:19:18Z")
I tried importing the dashboards again pointing to the Elastic Search host, and refreshed the Index lists.
But, still I hit the same issue.
Set-up Details:
Elastic Search - 5.1.1
Kibana - 5.1.1
Xpack Installed on above both
Metric Beat - Installed with 5.1.1
Thanks in advance.
Prakash
---
### Author:  [@Stacey\_Gammon](https://discuss.elastic.co/u/Stacey_Gammon)
#### Post date: [December 28, 2016, 2:20pm UTC](https://discuss.elastic.co/t/saved-field-parameter-is-now-invalid-please-select-a-new-field-visualize-field-is-a-required-parameter/70034/6 "2016-12-28T14:20:17Z")
Okay, I was able to repro by creating a metric visualization with a field that is missing a type. I'm not sure how the import\_dashboards script is creating such a field (this I can't repro), but I suspect this to be the issue.
Can you drill into one of the visualizations on that dashboard? I want to see if there are any errors in the edit pane, which might tell us more about which is the faulty field.
Can you also send me a screenshot of your field list sorted by type, so that fields with no type float to the top? I want to see if a field in one of those visualizations is missing it's type.

---
### Author:  [@prakash1243](https://discuss.elastic.co/u/prakash1243)
#### Post date: [December 30, 2016, 4:15am UTC](https://discuss.elastic.co/t/saved-field-parameter-is-now-invalid-please-select-a-new-field-visualize-field-is-a-required-parameter/70034/8 "2016-12-30T04:15:47Z")
Hi -
I've captured the fields of the Metric beat and attached it on this post. I don't see any fields which is left out with empty type.
I've attached the image with all the fields (i had to upload all 605 fields, so the image uploaded has got less resolution, so please zoom-in a little. Sorry for that.)

Stacey\_Gammon ::::::: Can you drill into one of the visualizations on that dashboard? I want to see if there are any errors in the edit pane, which might tell us more about which is the faulty field.
Prakash::: Could you please elaborate little bit on the above point ?
As per my understanding, I tried clicking the Edit button on one of the tab on the Dashboard, which took me to the Visualize Menu and I could see the details of it there. I think, the problem is only while rendering the details on the Dashboard, Sorry if my understanding is incorrect.
Thanks in advance.
---
### Author:  [@Stacey\_Gammon](https://discuss.elastic.co/u/Stacey_Gammon)
#### Post date: [December 30, 2016, 1:50pm UTC](https://discuss.elastic.co/t/saved-field-parameter-is-now-invalid-please-select-a-new-field-visualize-field-is-a-required-parameter/70034/9 "2016-12-30T13:50:29Z")
Very interesting, apparently this is not related to the issue I encountered where field type was missing.
Hmm, can you try deleting some of the visualizations off the dashboard one by one? Maybe we can pinpoint a single visualization as the culprit. You can see data from some of the dashboards, correct, just not the Cpu and Overview ones?
Can you open the spy panels of the visualizations and view the Request and Response? There is a little `^` button near the bottom left of a visualization that should appear when you hover over it. This should open up the "Spy panel".

---
### Author:  [@prakash1243](https://discuss.elastic.co/u/prakash1243)
#### Post date: [December 31, 2016, 3:46am UTC](https://discuss.elastic.co/t/saved-field-parameter-is-now-invalid-please-select-a-new-field-visualize-field-is-a-required-parameter/70034/10 "2016-12-31T03:46:08Z")
WoW, you are absolutely right.
There are few tabs, which has empty requests, After removing those, Kibana populated data on the other tabs. I've attached screenshot of it.
,
And I've also took the screenshots of the empty requests on the tabs, which exists on the Overview and Cpu/Memory Per Container dashboards.
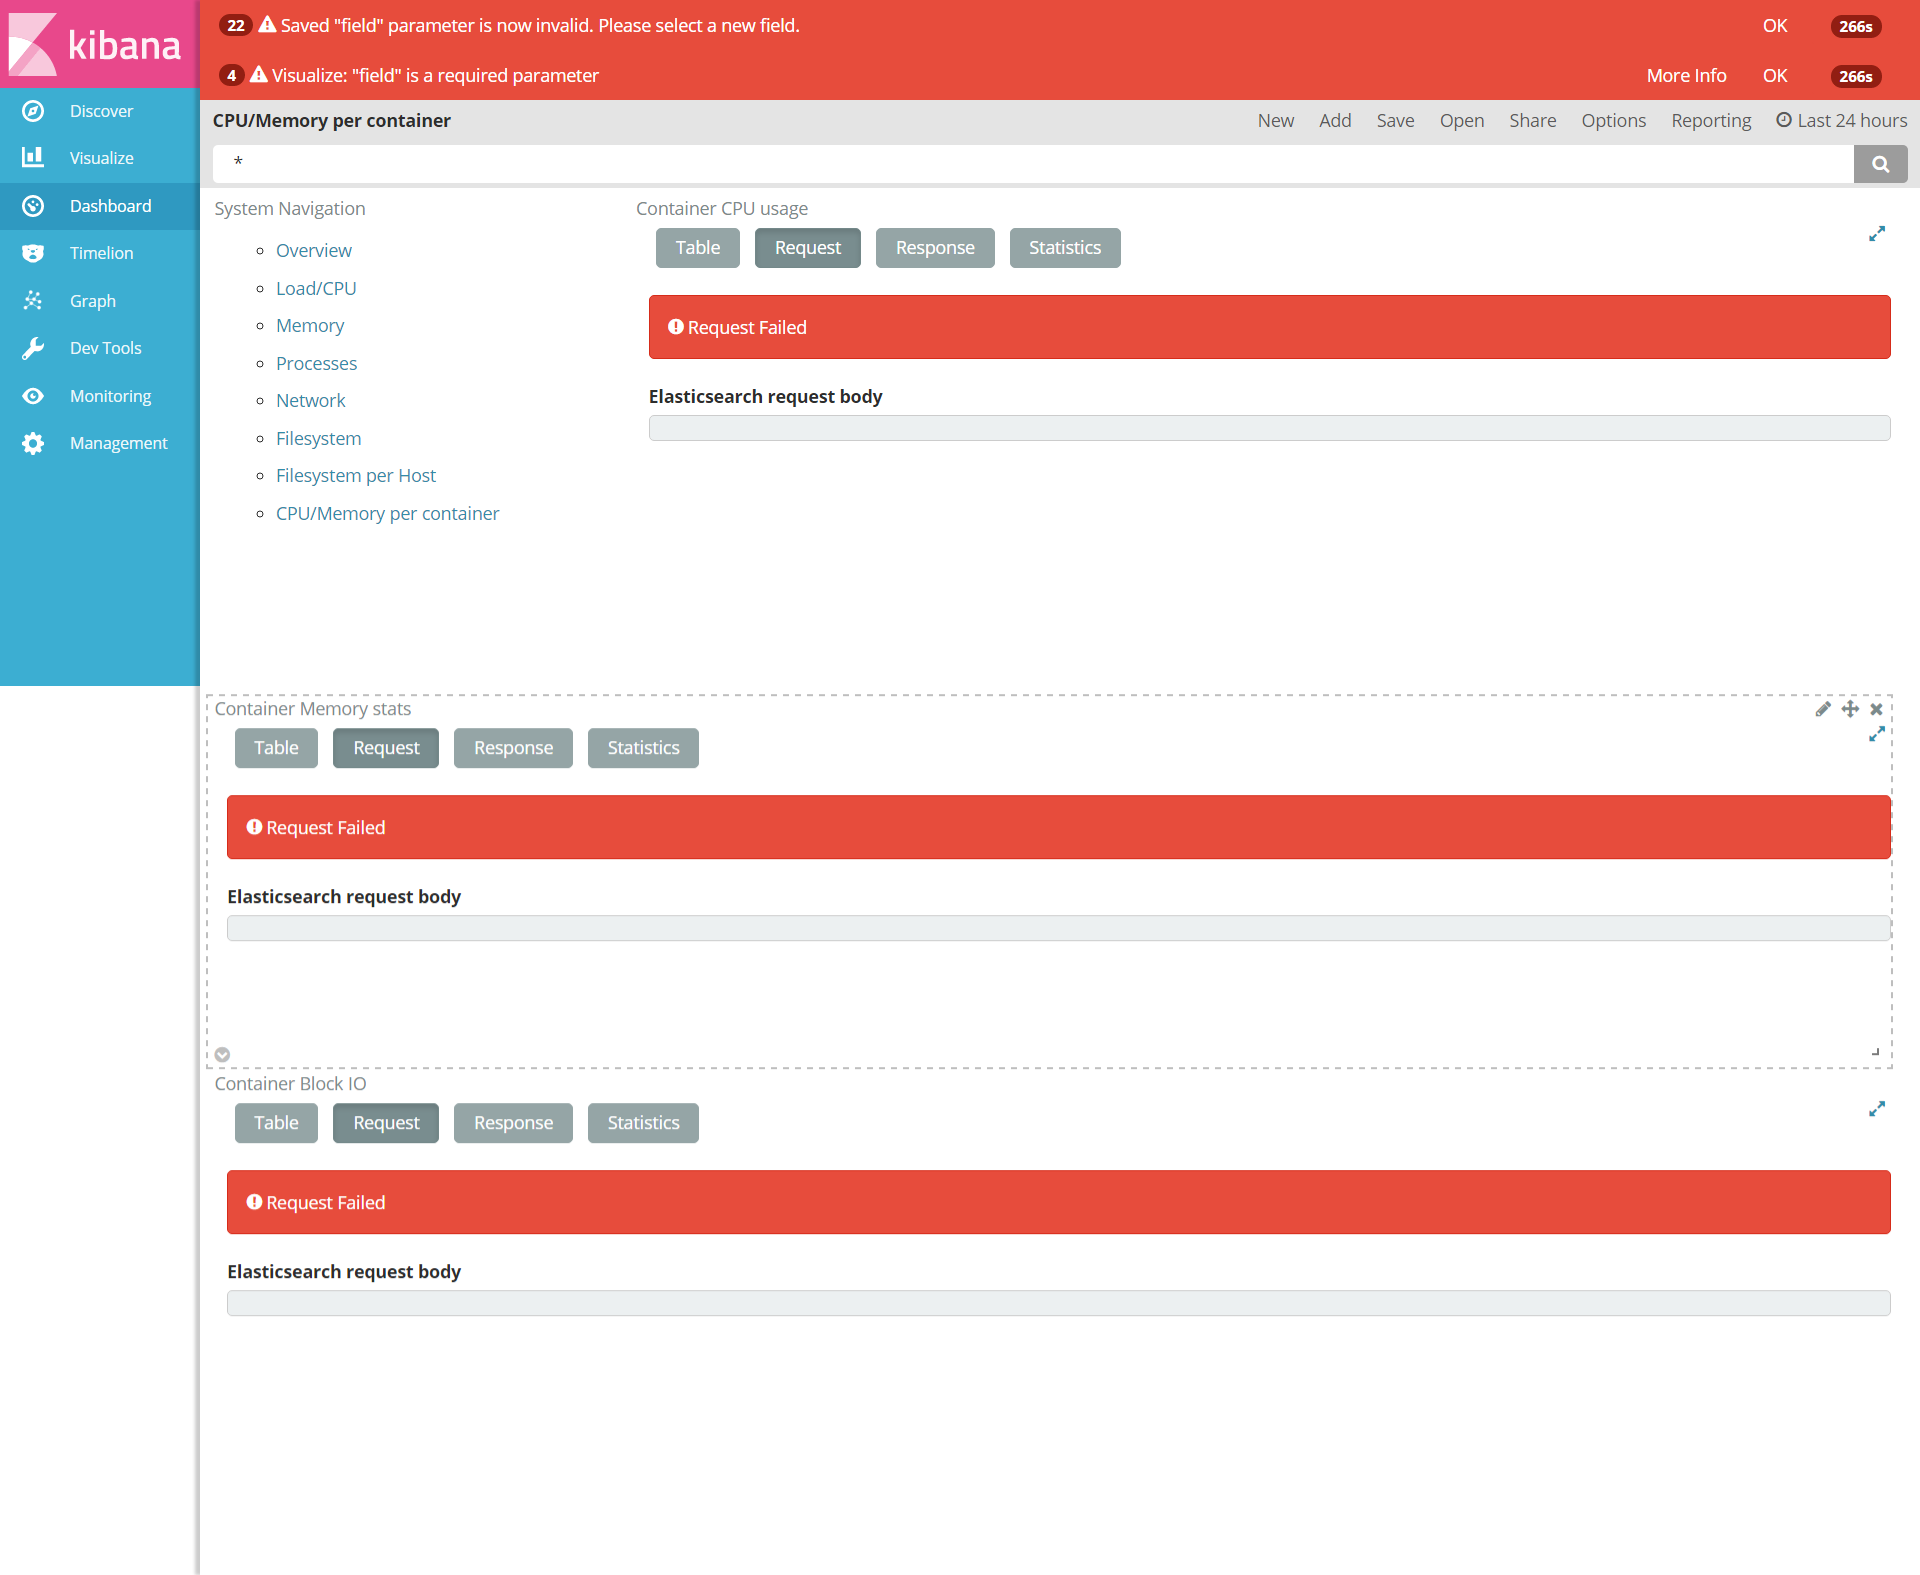 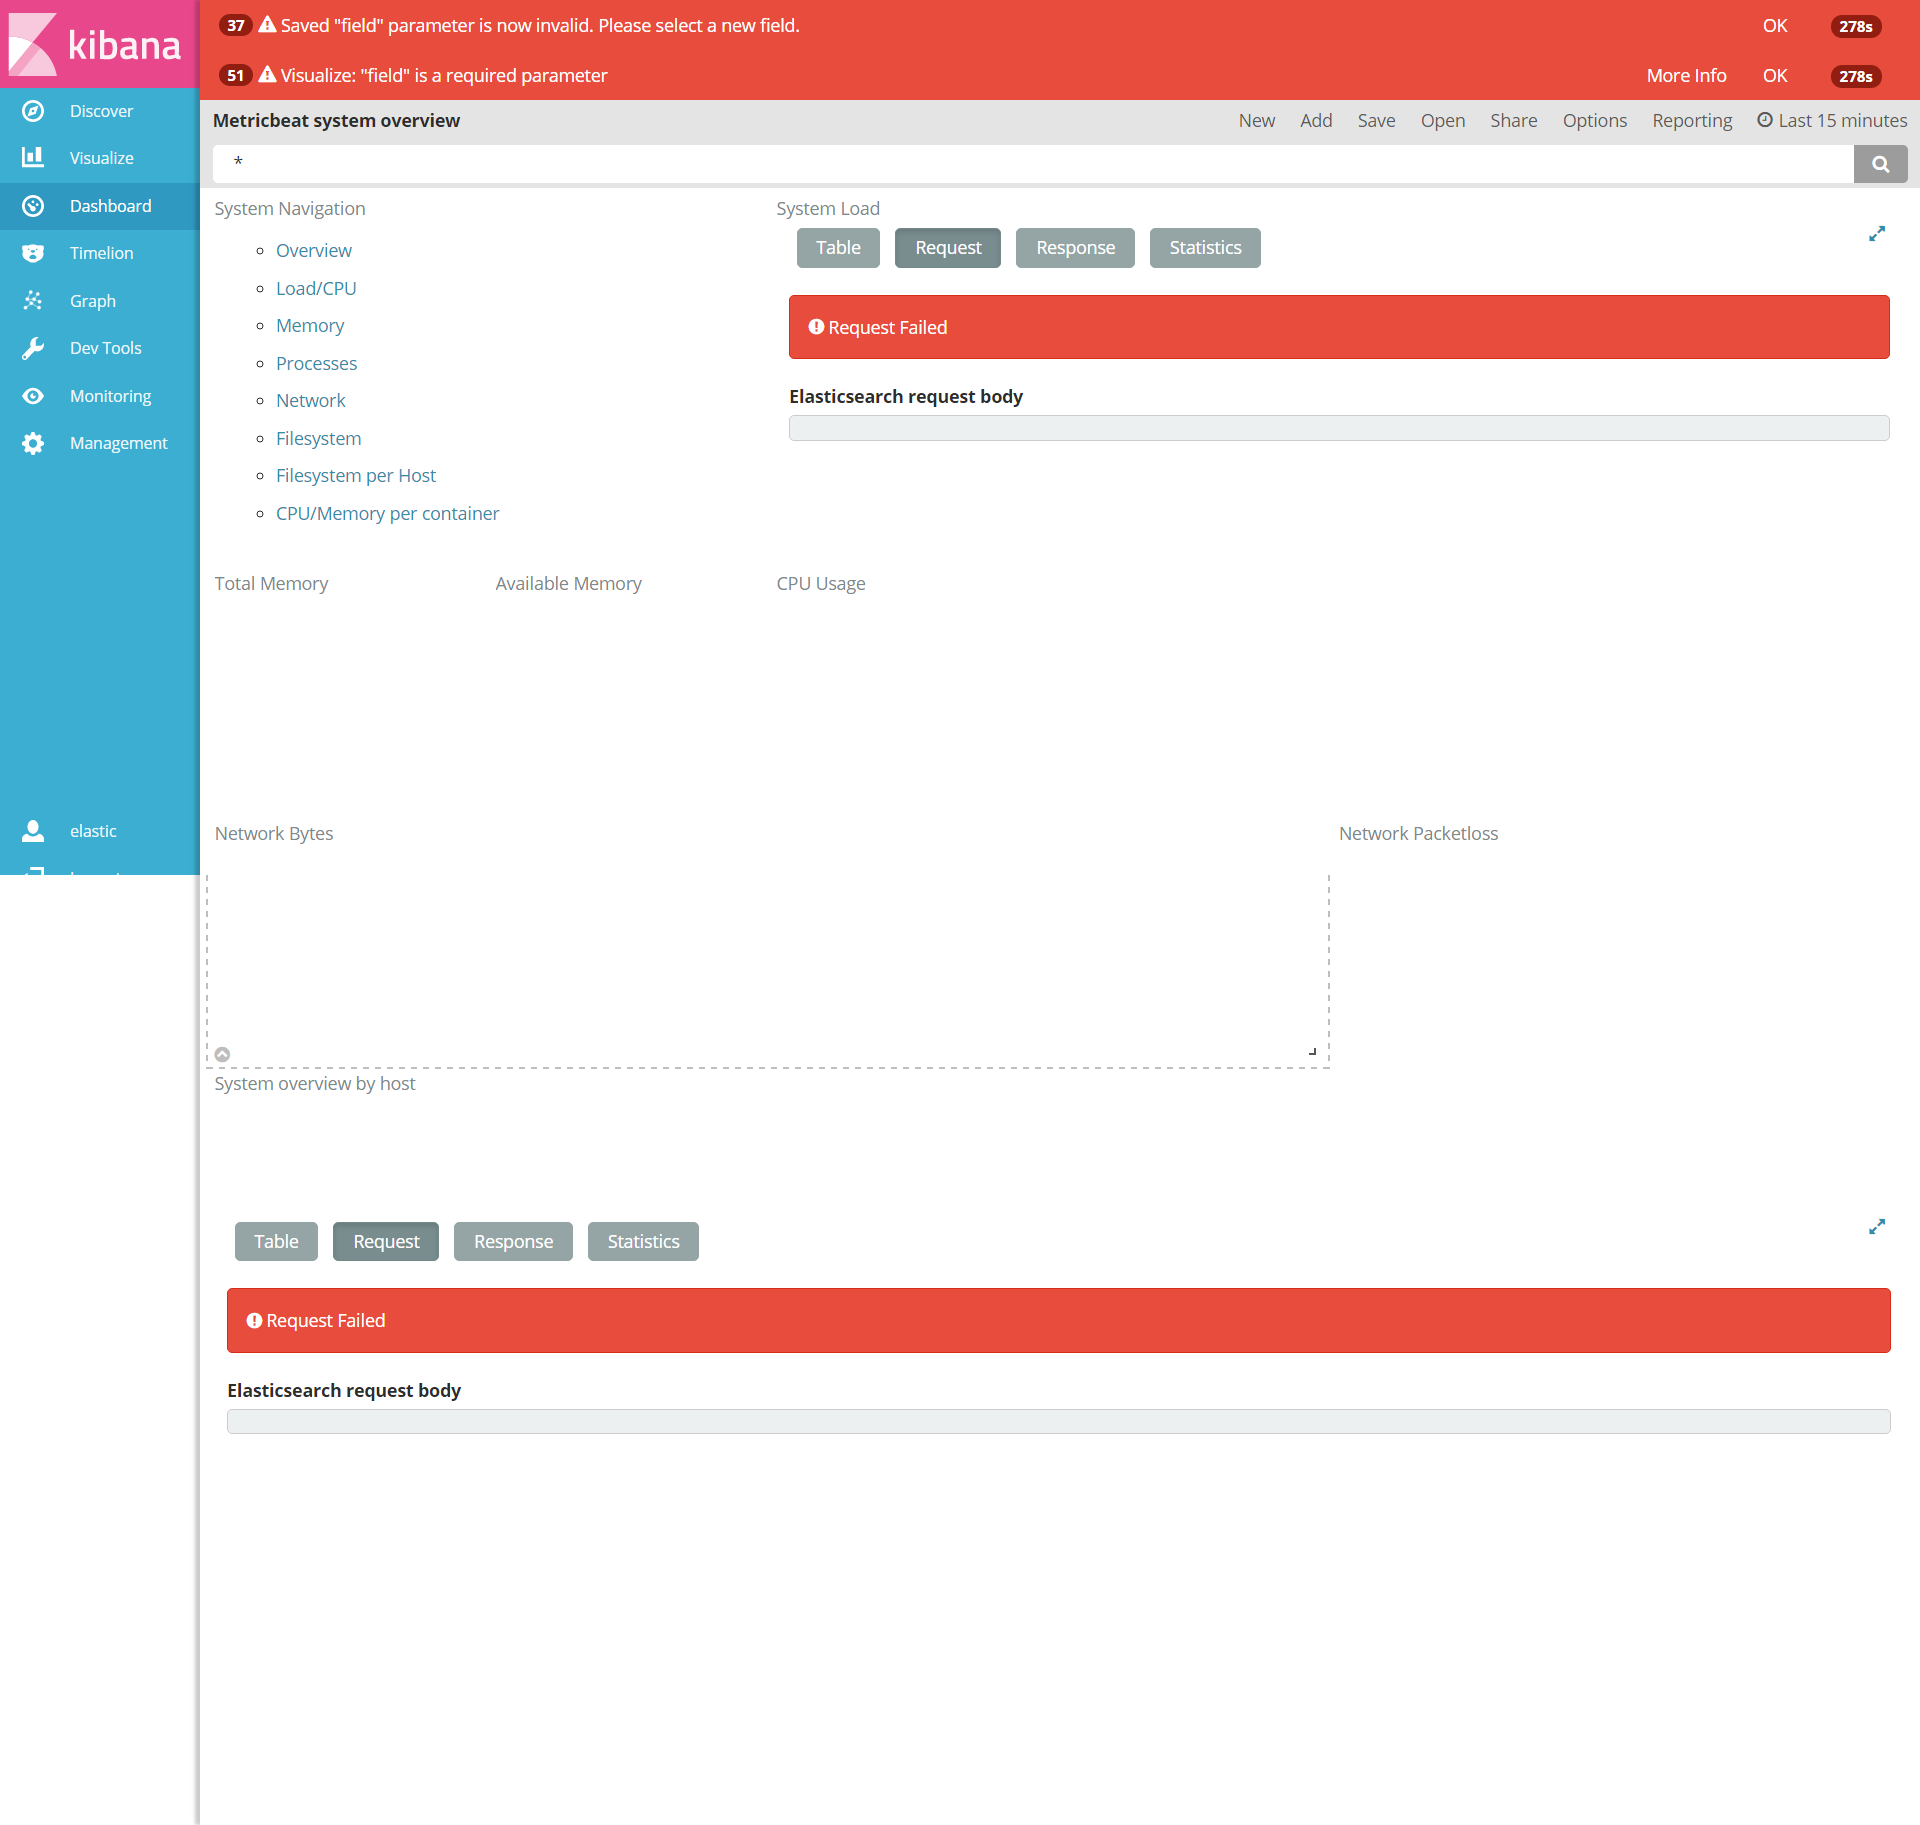
Please let me know, if we have any work around to get this issue fixed? Thanks in advance.
Happy New Year. 🙂
---
### Author:  [@prakash1243](https://discuss.elastic.co/u/prakash1243)
#### Post date: [January 3, 2017, 4:07am UTC](https://discuss.elastic.co/t/saved-field-parameter-is-now-invalid-please-select-a-new-field-visualize-field-is-a-required-parameter/70034/11 "2017-01-03T04:07:12Z")
Hi Stacey\_Gammon -
Could you please help me in resolving this issue. Thanks !
Regards,
Prakash
---
### Author:  [@Stacey\_Gammon](https://discuss.elastic.co/u/Stacey_Gammon)
#### Post date: [January 3, 2017, 2:46pm UTC](https://discuss.elastic.co/t/saved-field-parameter-is-now-invalid-please-select-a-new-field-visualize-field-is-a-required-parameter/70034/12 "2017-01-03T14:46:59Z")
Sorry about that, this slipped off my radar.
What do you get if you go into dev tools and run the following command:
```auto
POST met*/_search
{
"size": 0,
"aggs": {
"1": {
"avg": {
"field": "system.load.norm.1"
}
},
"2": {
"avg": {
"field": "system.load.norm.5"
}
},
"3": {
"avg": {
"field": "system.load.norm.15"
}
}
},
"query": {
"bool": {
"must": [
{
"query_string": {
"query": "metricset.module: system AND metricset.name: load",
"analyze_wildcard": true
}
}
]
}
}
}
```
> [@prakash1243](#):
>
> I tried clicking the Edit button on one of the tab on the Dashboard, which took me to the Visualize Menu and I could see the details of it there.
Can you try this with the `System Load` visualization? I'm hoping it will confirm the invalid field(s).
---
### Author:  [@prakash1243](https://discuss.elastic.co/u/prakash1243)
#### Post date: [January 4, 2017, 3:52am UTC](https://discuss.elastic.co/t/saved-field-parameter-is-now-invalid-please-select-a-new-field-visualize-field-is-a-required-parameter/70034/13 "2017-01-04T03:52:12Z")
Hi-
I ran the post request and here is the response below:
{
"took": 54,
"timed\_out": false,
"\_shards": {
"total": 40,
"successful": 40,
"failed": 0
},
"hits": {
"total": 0,
"max\_score": 0,
"hits": []
},
"aggregations": {
"1": {
"value": null
},
"2": {
"value": null
},
"3": {
"value": null
}
}
}
---
### Author:  [@prakash1243](https://discuss.elastic.co/u/prakash1243)
#### Post date: [January 4, 2017, 3:56am UTC](https://discuss.elastic.co/t/saved-field-parameter-is-now-invalid-please-select-a-new-field-visualize-field-is-a-required-parameter/70034/14 "2017-01-04T03:56:55Z")
Here is the System Load Visulization snapshot:
Thanks for your help !!

---
### Author:  [@Stacey\_Gammon](https://discuss.elastic.co/u/Stacey_Gammon)
#### Post date: [January 4, 2017, 2:30pm UTC](https://discuss.elastic.co/t/saved-field-parameter-is-now-invalid-please-select-a-new-field-visualize-field-is-a-required-parameter/70034/15 "2017-01-04T14:30:10Z")
Can you set the fields in the left hand data to be `system.load.norm.1`, `system.load.norm.5` and `system.load.norm.15`?
I took a second look at your field list and I believe the issue is that some of your fields aren't marked as searchable and aggregatable like they are in mine. Hence the first error message is that the original field choices were invalid, and the second error message is letting you know that that is a required field.
You used the import\_dashboards script from metricbeat 5.1.1 right?
Can you run the following command in Dev Tools, then do a search for `system.load.norm` in the results and paste the outcome (see the screenshot).
```auto
POST .kibana/_search/
{
"query": {
"bool": {
"must": [
{
"query_string": {
"analyze_wildcard": true,
"query": "_type: index-pattern AND system.load.norm.15"
}
}
]
}
}
}
```

You can see how the `system.load.norm` fields in my results have `searchable` and `aggregatable` set to `true`.
---
### Author:  [@Stacey\_Gammon](https://discuss.elastic.co/u/Stacey_Gammon)
#### Post date: [January 4, 2017, 3:31pm UTC](https://discuss.elastic.co/t/saved-field-parameter-is-now-invalid-please-select-a-new-field-visualize-field-is-a-required-parameter/70034/16 "2017-01-04T15:31:26Z")
Can you also run
```auto
GET metricbeat*/_mapping/metricsets/field/system.load.norm.15
```
and
```auto
GET /_field_stats?fields=system.load.norm.15
```
in dev tools and send me the output?
Refreshing the field list in management (the yellow button) should correct those fields to be marked as searchable and aggregatable, unless their is an issue with no data existing for those fields.

---
### Author:  [@prakash1243](https://discuss.elastic.co/u/prakash1243)
#### Post date: [January 5, 2017, 4:24am UTC](https://discuss.elastic.co/t/saved-field-parameter-is-now-invalid-please-select-a-new-field-visualize-field-is-a-required-parameter/70034/17 "2017-01-05T04:24:43Z")
[quote="Stacey\_Gammon, pos
t:15, topic:70034"]
system.load.norm.15
[/quote]
Hi -
Yes, Am using metricbeat-5.1.1 and I've run the query in the dev tools and attached the screenshot, I believe the values are set to be false on my set-up.

---
### Author:  [@prakash1243](https://discuss.elastic.co/u/prakash1243)
#### Post date: [January 5, 2017, 4:43am UTC](https://discuss.elastic.co/t/saved-field-parameter-is-now-invalid-please-select-a-new-field-visualize-field-is-a-required-parameter/70034/18 "2017-01-05T04:43:29Z")
Hi -
Yep, I had executed those two requests and attached the output here:
# GET metricbeat\*/\_mapping/metricsets/field/system.load.norm.15
{
"metricbeat-2016.12.29": {
"mappings": {
"metricsets": {
"system.load.norm.15": {
"full\_name": "system.load.norm.15",
"mapping": {
"15": {
"type": "scaled\_float",
"scaling\_factor": 100
}
}
}
}
}
},
"metricbeat-2017.01.02": {
"mappings": {
"metricsets": {
"system.load.norm.15": {
"full\_name": "system.load.norm.15",
"mapping": {
"15": {
"type": "scaled\_float",
"scaling\_factor": 100
}
}
}
}
}
},
"metricbeat-2017.01.03": {
"mappings": {
"metricsets": {
"system.load.norm.15": {
"full\_name": "system.load.norm.15",
"mapping": {
"15": {
"type": "scaled\_float",
"scaling\_factor": 100
}
}
}
}
}
},
"metricbeat-2017.01.04": {
"mappings": {
"metricsets": {
"system.load.norm.15": {
"full\_name": "system.load.norm.15",
"mapping": {
"15": {
"type": "scaled\_float",
"scaling\_factor": 100
}
}
}
}
}
},
"metricbeat-2016.12.31": {
"mappings": {
"metricsets": {
"system.load.norm.15": {
"full\_name": "system.load.norm.15",
"mapping": {
"15": {
"type": "scaled\_float",
"scaling\_factor": 100
}
}
}
}
}
},
"metricbeat-2017.01.05": {
"mappings": {
"metricsets": {
"system.load.norm.15": {
"full\_name": "system.load.norm.15",
"mapping": {
"15": {
"type": "scaled\_float",
"scaling\_factor": 100
}
}
}
}
}
},
"metricbeat": {
"mappings": {}
},
"metricbeat-2016.12.26": {
"mappings": {
"metricsets": {
"system.load.norm.15": {
"full\_name": "system.load.norm.15",
"mapping": {
"15": {
"type": "scaled\_float",
"scaling\_factor": 100
}
}
}
}
}
},
"metricbeat-2016.12.27": {
"mappings": {
"metricsets": {
"system.load.norm.15": {
"full\_name": "system.load.norm.15",
"mapping": {
"15": {
"type": "scaled\_float",
"scaling\_factor": 100
}
}
}
}
}
},
"metricbeat-2016.12.28": {
"mappings": {
"metricsets": {
"system.load.norm.15": {
"full\_name": "system.load.norm.15",
"mapping": {
"15": {
"type": "scaled\_float",
"scaling\_factor": 100
}
}
}
}
}
}
}
# GET /\_field\_stats?fields=system.load.norm.15
{
"\_shards": {
"total": 144,
"successful": 144,
"failed": 0
},
"indices": {
"\_all": {
"fields": {}
}
}
}
And also I had filtered with system.load in Index patterns (refreshed the field list) and I don't think those fields are changed to Aggregatable. And I've attached the screenshot here.

---
### Author:  [@Stacey\_Gammon](https://discuss.elastic.co/u/Stacey_Gammon)
#### Post date: [January 5, 2017, 2:11pm UTC](https://discuss.elastic.co/t/saved-field-parameter-is-now-invalid-please-select-a-new-field-visualize-field-is-a-required-parameter/70034/19 "2017-01-05T14:11:51Z")
Ah, so I believe the problem is that there is no data in your index for those fields. When there is no data for that field, the field\_stats api won't return anything, which means Kibana will mark it as not search/aggregatabable/etc and the visualization will throw an error.
I'm going to guess if you run this query:
`GET metric*/metricsets/_search?q=system.load.norm.15:>0`
you would not get any hits. Can you confirm this?
You might be able to manually insert a single data point for that field so the visualization doesn't throw an error, but that's pretty pointless if you are actually interested in those stats. The real question is why metricbeat isn't sending data for that field.
---
### Author:  [@Stacey\_Gammon](https://discuss.elastic.co/u/Stacey_Gammon)
#### Post date: [January 5, 2017, 2:19pm UTC](https://discuss.elastic.co/t/saved-field-parameter-is-now-invalid-please-select-a-new-field-visualize-field-is-a-required-parameter/70034/20 "2017-01-05T14:19:56Z")
Here are some relevant git issues about the reason the visualizations are failing when there is no data for the field:
>
>
---
### Author:  [@Stacey\_Gammon](https://discuss.elastic.co/u/Stacey_Gammon)
#### Post date: [January 5, 2017, 5:29pm UTC](https://discuss.elastic.co/t/saved-field-parameter-is-now-invalid-please-select-a-new-field-visualize-field-is-a-required-parameter/70034/21 "2017-01-05T17:29:09Z")
Okay, I may have a solution to fix your dashboards. Try re-running the metricbeat import script, and this time **do not** refresh the field list. This should bypass the field\_stats api and hopefully preserve the correct information for the field.
[Next page](https://discuss.elastic.co/t/saved-field-parameter-is-now-invalid-please-select-a-new-field-visualize-field-is-a-required-parameter/70034.md?page=2)