# SNMP Pipeline didn't work
**URL:** https://discuss.elastic.co/t/snmp-pipeline-didnt-work/315003
**Category:** Logstash
**Created:** [September 23, 2022, 9:29am UTC](https://discuss.elastic.co/t/snmp-pipeline-didnt-work/315003 "2022-09-23T09:29:58Z")
**Posts on this page:** 2
**Page:** 1
### Author:  [@yuswanul](https://discuss.elastic.co/u/yuswanul)
#### Post date: [September 23, 2022, 9:29am UTC](https://discuss.elastic.co/t/snmp-pipeline-didnt-work/315003/1 "2022-09-23T09:29:58Z")
Hello everyone,
i'm struggling with snmp pipeline here. i have configured the pipeline like below picture. i used walk and define the tables too. when i run the logstash, there is no error log about this pipeline. it's just normal and looks fine, but when i go to kibana discover and then i filter the data to this IP ,the log is missing

i have another entry like this and this works fine. the log from this host continuously popping up on elastic
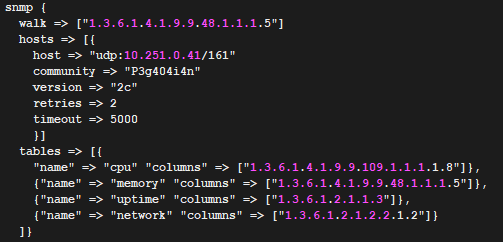
can you help me to solve this?
---
### Author:  [@system](https://discuss.elastic.co/u/system)
#### Post date: [October 21, 2022, 9:30am UTC](https://discuss.elastic.co/t/snmp-pipeline-didnt-work/315003/2 "2022-10-21T09:30:34Z")
This topic was automatically closed 28 days after the last reply. New replies are no longer allowed.