# Split series containing top N terms sorted by numeric field
**URL:** https://discuss.elastic.co/t/split-series-containing-top-n-terms-sorted-by-numeric-field/168402
**Category:** Kibana
**Created:** [February 14, 2019, 11:52am UTC](https://discuss.elastic.co/t/split-series-containing-top-n-terms-sorted-by-numeric-field/168402 "2019-02-14T11:52:45Z")
**Posts on this page:** 6
**Page:** 1
### Author:  [@gciubotaru](https://discuss.elastic.co/u/gciubotaru)
#### Post date: [February 14, 2019, 11:52am UTC](https://discuss.elastic.co/t/split-series-containing-top-n-terms-sorted-by-numeric-field/168402/1 "2019-02-14T11:52:45Z")
Hello,
I need a bit of help to build a split series visualization.
I have an time-series index containing temperature and humidity in different locations. Here is a sample entry:
```
{
"@timestamp": "2019-02-04T00:00:00",
"location": "Rome",
"temperature": 26,
"humidity": 43
}
```
I want to build a line chart that displays for a time range a graph of humidity over time for each of top 5 hottest locations (so practically get max temperature for all locations in the time range and get top 5). Is this achievable in Kibana?
Thank you.
---
### Author:  [@jbudz](https://discuss.elastic.co/u/jbudz)
#### Post date: [February 14, 2019, 7:00pm UTC](https://discuss.elastic.co/t/split-series-containing-top-n-terms-sorted-by-numeric-field/168402/2 "2019-02-14T19:00:16Z")
I think so. Which visual builder are you using?
If it's a line chart -\>
metric: max or average humidity, whichever you're looking for
Terms aggregation =\> temperature ordered by custom metric (avg temperature) =\> date histogram
---
### Author:  [@gciubotaru](https://discuss.elastic.co/u/gciubotaru)
#### Post date: [February 14, 2019, 10:15pm UTC](https://discuss.elastic.co/t/split-series-containing-top-n-terms-sorted-by-numeric-field/168402/3 "2019-02-14T22:15:42Z")
Hi Jon,
Thanks for the answer.
I'm using Kibana and it's a line chart indeed. What you are describing is almost what I was able to come up with myself and that is:
- **Metric** : average "humidity"
- **Buckets** :
1. Split Series: Terms aggregation on "location" order by custom metric = max "temperature"
2. X-Axis: Date histogram on "@timestamp"
Unfortunately this doesn't produce the expected line chart because the data from the index is in multiple shards. In the mapping phase of the request each shard returns its own top 5 (which doesn't necessarily contain entries for the final top 5) and in the reduce phase the data from all shards is put together, the top 5 is identified but not all historical data for each of the top 5 locations is available.
Hopefully there is another solution for this.
Thanks.
---
### Author:  [@jbudz](https://discuss.elastic.co/u/jbudz)
#### Post date: [February 20, 2019, 4:26pm UTC](https://discuss.elastic.co/t/split-series-containing-top-n-terms-sorted-by-numeric-field/168402/4 "2019-02-20T16:26:17Z")
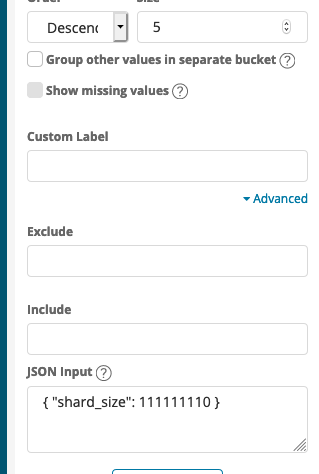
Hmm, that's a tough one. Is bumping the shard\_size an option? [https://www.elastic.co/guide/en/elasticsearch/reference/current/search-aggregations-bucket-terms-aggregation.html#\_shard\_size\_3](https://www.elastic.co/guide/en/elasticsearch/reference/current/search-aggregations-bucket-terms-aggregation.html#_shard_size_3)
---
### Author:  [@gciubotaru](https://discuss.elastic.co/u/gciubotaru)
#### Post date: [February 20, 2019, 9:35pm UTC](https://discuss.elastic.co/t/split-series-containing-top-n-terms-sorted-by-numeric-field/168402/5 "2019-02-20T21:35:28Z")
This works indeed but with the expected drawback: it takes much longer to produce a result since it needs to bring everything from each shard to the coordinating node. And in production might actually cause the whole system to fail due to memory pressure.
Also, if I set a lower value I won't be guaranteed to get the historical value for all top N.
But this is a great trick, thanks for pointing it out.
---
### Author:  [@system](https://discuss.elastic.co/u/system)
#### Post date: [March 20, 2019, 9:35pm UTC](https://discuss.elastic.co/t/split-series-containing-top-n-terms-sorted-by-numeric-field/168402/6 "2019-03-20T21:35:37Z")
This topic was automatically closed 28 days after the last reply. New replies are no longer allowed.