# Tag Cloud to only show current value
**URL:** https://discuss.elastic.co/t/tag-cloud-to-only-show-current-value/258165
**Category:** Kibana
**Created:** [December 9, 2020, 5:13pm UTC](https://discuss.elastic.co/t/tag-cloud-to-only-show-current-value/258165 "2020-12-09T17:13:11Z")
**Posts on this page:** 9
**Page:** 1
### Author:  [@fastxl](https://discuss.elastic.co/u/fastxl)
#### Post date: [December 9, 2020, 5:13pm UTC](https://discuss.elastic.co/t/tag-cloud-to-only-show-current-value/258165/1 "2020-12-09T17:13:11Z")
I am reading data in from a machine tool and I would like to visualize the current status. My document looks like this
```
@timestamp Dec 9, 2020 @ 10:44:00.867
@version 1
Events.Execution.@@data INTERRUPTED
Events.Execution.name pexecution
_id wrJjSHYBNhsRe95vYMcn
_index mtconnect-demo
_score -
_type _doc
componentId Mp1
dataItemId Mpexecution
deviceName OKUMA.MachiningCenterMA650-WEST
deviceUUID OKUMA.MachiningCenterMA650-WEST.188307
host mt-data-01
sequence 9,430,582
timestamp Dec 9, 2020 @ 10:41:18.000
type json
```
I would like the TAG cloud to show the latest `Events.Execution.@@data` How can I get my visualization to show just the latest one? Basically this will show the machine status so I just need the single latest value
---
### Author:  [@flash1293](https://discuss.elastic.co/u/flash1293)
#### Post date: [December 9, 2020, 6:01pm UTC](https://discuss.elastic.co/t/tag-cloud-to-only-show-current-value/258165/2 "2020-12-09T18:01:42Z")
If you just want to show the latest `Events.Execution.@@data` as a text on a dashboard, the "Metric" visualization in combination with the "top hits" aggregation is probably the right choice.
---
### Author:  [@fastxl](https://discuss.elastic.co/u/fastxl)
#### Post date: [December 9, 2020, 7:24pm UTC](https://discuss.elastic.co/t/tag-cloud-to-only-show-current-value/258165/3 "2020-12-09T19:24:00Z")
Thanks for the direction. When I do "Metric" with a "Top Hit" aggregation and add Buckets of Events.Execution.@@data.keyword I don't seem to get the "latest". Here are some screen grabs of my settings


---
### Author:  [@flash1293](https://discuss.elastic.co/u/flash1293)
#### Post date: [December 10, 2020, 10:32am UTC](https://discuss.elastic.co/t/tag-cloud-to-only-show-current-value/258165/4 "2020-12-10T10:32:08Z")
This is not the "Metric" visualization type. Can you explain the chart you want to see? I thought it was just about showing the single latest value of `Events.Execution.@@data`
---
### Author:  [@fastxl](https://discuss.elastic.co/u/fastxl)
#### Post date: [December 10, 2020, 12:42pm UTC](https://discuss.elastic.co/t/tag-cloud-to-only-show-current-value/258165/5 "2020-12-10T12:42:27Z")
I think I figured it out. No need for the Buckets. Here is what I did to get the value I want.
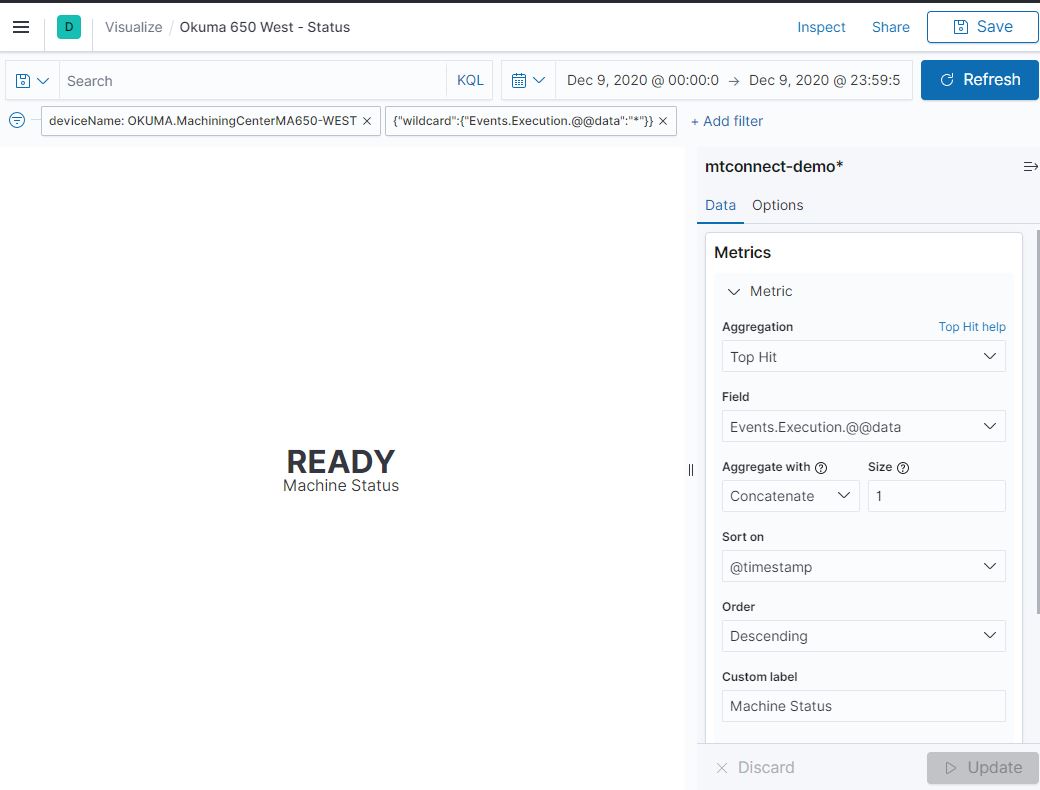
Now is there anyway to change the color of the metric based on the word? Like Green for Active and RED for STOPPED?
---
### Author:  [@flash1293](https://discuss.elastic.co/u/flash1293)
#### Post date: [December 10, 2020, 6:04pm UTC](https://discuss.elastic.co/t/tag-cloud-to-only-show-current-value/258165/6 "2020-12-10T18:04:24Z")
Yes, that's what I meant.
> Now is there anyway to change the color of the metric based on the word? Like Green for Active and RED for STOPPED?
You should be able to do this by going to the index pattern and configuring the "color" field formatter for the `Events.Execution.@@data`
---
### Author:  [@fastxl](https://discuss.elastic.co/u/fastxl)
#### Post date: [December 10, 2020, 7:47pm UTC](https://discuss.elastic.co/t/tag-cloud-to-only-show-current-value/258165/7 "2020-12-10T19:47:12Z")
Not sure how to do that but I will look into it (suggestions on where to start?). Thanks for the help
---
### Author:  [@flash1293](https://discuss.elastic.co/u/flash1293)
#### Post date: [December 14, 2020, 9:52am UTC](https://discuss.elastic.co/t/tag-cloud-to-only-show-current-value/258165/8 "2020-12-14T09:52:53Z")
Go to Management \> Index patterns \> your index pattern \> edit the `Events.Execution.@@data` field \> pick the "color" formatter
---
### Author:  [@system](https://discuss.elastic.co/u/system)
#### Post date: [January 11, 2021, 9:53am UTC](https://discuss.elastic.co/t/tag-cloud-to-only-show-current-value/258165/9 "2021-01-11T09:53:25Z")
This topic was automatically closed 28 days after the last reply. New replies are no longer allowed.