# Timelion: Getting more than 100% for CPU usage
**URL:** https://discuss.elastic.co/t/timelion-getting-more-than-100-for-cpu-usage/65688
**Category:** Kibana
**Created:** [November 10, 2016, 3:17pm UTC](https://discuss.elastic.co/t/timelion-getting-more-than-100-for-cpu-usage/65688 "2016-11-10T15:17:41Z")
**Posts on this page:** 6
**Page:** 1
### Author:  [@tomx1](https://discuss.elastic.co/u/tomx1)
#### Post date: [November 10, 2016, 3:17pm UTC](https://discuss.elastic.co/t/timelion-getting-more-than-100-for-cpu-usage/65688/1 "2016-11-10T15:17:41Z")
I'm using metricbeat to collect metricdata for a few debian servers. I've built the following chart in Timelion:

This is the query for it:
> .es(metric=cardinality:system.process.cpu.total.pct).trim().movingaverage(5).label('cpu usage %'), .es(metric=cardinality:system.process.cpu.total.pct).trim().movingaverage(5).trend().label('Trend')
Can someone tell me why the yaxis is drawing graphs over 100%? How is that possible?
---
### Author:  [@alainc](https://discuss.elastic.co/u/alainc)
#### Post date: [November 10, 2016, 4:56pm UTC](https://discuss.elastic.co/t/timelion-getting-more-than-100-for-cpu-usage/65688/2 "2016-11-10T16:56:40Z")
just an idea your cpu have more than one cpu core and it's a sum of multiple cpu core and not one by one.
---
### Author:  [@tomx1](https://discuss.elastic.co/u/tomx1)
#### Post date: [November 17, 2016, 9:53am UTC](https://discuss.elastic.co/t/timelion-getting-more-than-100-for-cpu-usage/65688/3 "2016-11-17T09:53:11Z")
You are almost right alainc: I found out that the graph is suming up data of 3 Servers. The reason is that the Host filter in the Kibana Dashboard is not working for a specific Host.... the filter is working for two hosts but not for the third one - have no idea why.
---
### Author:  [@st1t](https://discuss.elastic.co/u/st1t)
#### Post date: [November 17, 2016, 3:30pm UTC](https://discuss.elastic.co/t/timelion-getting-more-than-100-for-cpu-usage/65688/4 "2016-11-17T15:30:01Z")
Hi tomx1.
If you want to draw a CPU graph of a specific host, how about narrowing down to such with a query on the timelion side?
```auto
.es(metric=cardinality:system.process.cpu.total.pct,q=beat.hostname:'HOSTNAME').trim().movingaverage(5).label('cpu usage %'),
.es(metric=cardinality:system.process.cpu.total.pct,q=beat.hostname:'HOSTNAME').trim().movingaverage(5).trend().label('Trend')
```
It may be good to display CPU utilization of all servers.
```auto
.es(metric=cardinality:system.process.cpu.total.pct,split=beat.hostname:5).trim().movingaverage(5).label(label='cpu usage % : ',regex='.*name.*:').label(label='',regex='>.*'),
.es(metric=cardinality:system.process.cpu.total.pct,split=beat.hostname:5).trim().movingaverage(5).trend().label(label='Trend : ',regex='.*name.*:').label(label='',regex='>.*')
```
I hope that information helps.
---
### Author:  [@tomx1](https://discuss.elastic.co/u/tomx1)
#### Post date: [November 18, 2016, 8:56am UTC](https://discuss.elastic.co/t/timelion-getting-more-than-100-for-cpu-usage/65688/5 "2016-11-18T08:56:12Z")
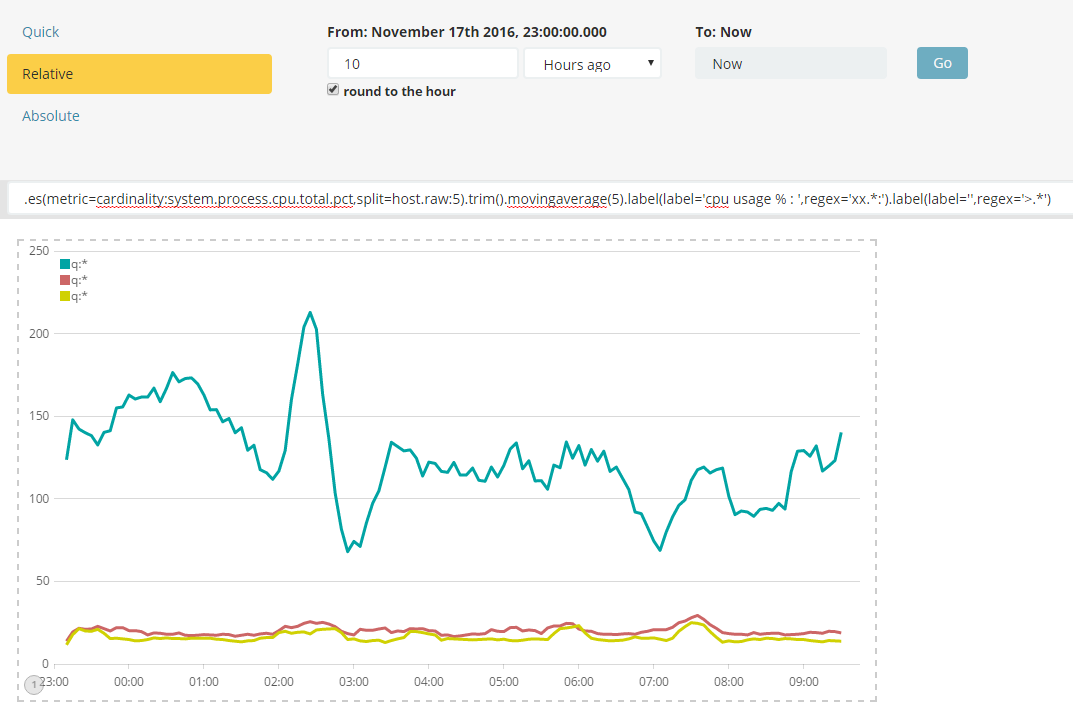
Thanks st1t, these are some really useful queries. But i stil think that there may exists a bug calculating these charts. I have used your Query to show the cpu usage of two Servers. Everything looks fine:

However, if i switch to 10 hours ago instead of 9 hours, the chart makes no sense anymore. As soon as i show more than the current day, timelion is summing up things here:
---
### Author:  [@system](https://discuss.elastic.co/u/system)
#### Post date: [December 16, 2016, 8:56am UTC](https://discuss.elastic.co/t/timelion-getting-more-than-100-for-cpu-usage/65688/6 "2016-12-16T08:56:36Z")
This topic was automatically closed 28 days after the last reply. New replies are no longer allowed.