# Timelion: Help for plotting calculated MovingAverage
**URL:** https://discuss.elastic.co/t/timelion-help-for-plotting-calculated-movingaverage/78814
**Category:** Kibana
**Tags:** timelion
**Created:** [March 16, 2017, 8:41am UTC](https://discuss.elastic.co/t/timelion-help-for-plotting-calculated-movingaverage/78814 "2017-03-16T08:41:31Z")
**Posts on this page:** 3
**Page:** 1
### Author:  [@Ruthu\_Ramya](https://discuss.elastic.co/u/Ruthu_Ramya)
#### Post date: [March 16, 2017, 8:41am UTC](https://discuss.elastic.co/t/timelion-help-for-plotting-calculated-movingaverage/78814/1 "2017-03-16T08:41:31Z")
Hi,
I am exploring timelion vis so as to plot a movingaverage graph for my example below:
Log file:(Plane-ID and corresponding Timestamp are stored in Elasticsearch)
> Jan 30,14:49:56.785 INFO Plane 1A landed
> Jan 30,14:49:57.099 INFO Plane 2B landed
> Jan 30,14:49:57.368 INFO Plane 2C landed
> Jan 30,14:49:57.620 INFO Plane 2D landed
> Jan 30,14:49:57.900 INFO Plane 5X landed
> Jan 30,14:49:58.267 INFO Plane 6G landed
I need moving average for every 3rd flight that lands.
> y-axis : [3 / (Timestamp(2C) - Timestamp(1A)), 3 / (Timestamp(2D) - Timestamp(2B)), 3 / (Timestamp(5X) - Timestamp(2C))]
I tried this:
> .es(metric='max:LandingTime').movingaverage(3)
But seems like it gives some other plot (may be 3 seconds or minutes, I'm not sure)
1.How can I achieve this graph?
2.Is timelion the right choice or it is not suitable in this case, any better suggestions?
3.Can X axis be something other than timestamp (ex: difference between time at which the first flight landed and the current flight)
Can somebody help please, stuck at this place from long time without solution. Thanks.
Regards,
Ruthu
---
### Author:  [@Brandon\_Kobel](https://discuss.elastic.co/u/Brandon_Kobel)
#### Post date: [March 16, 2017, 1:13pm UTC](https://discuss.elastic.co/t/timelion-help-for-plotting-calculated-movingaverage/78814/2 "2017-03-16T13:13:48Z")
@Ruthu_Ramya Timelion uses Elasticsearch to aggregate/bucket the information based on the interval highlighted below before applying the moving average calculation
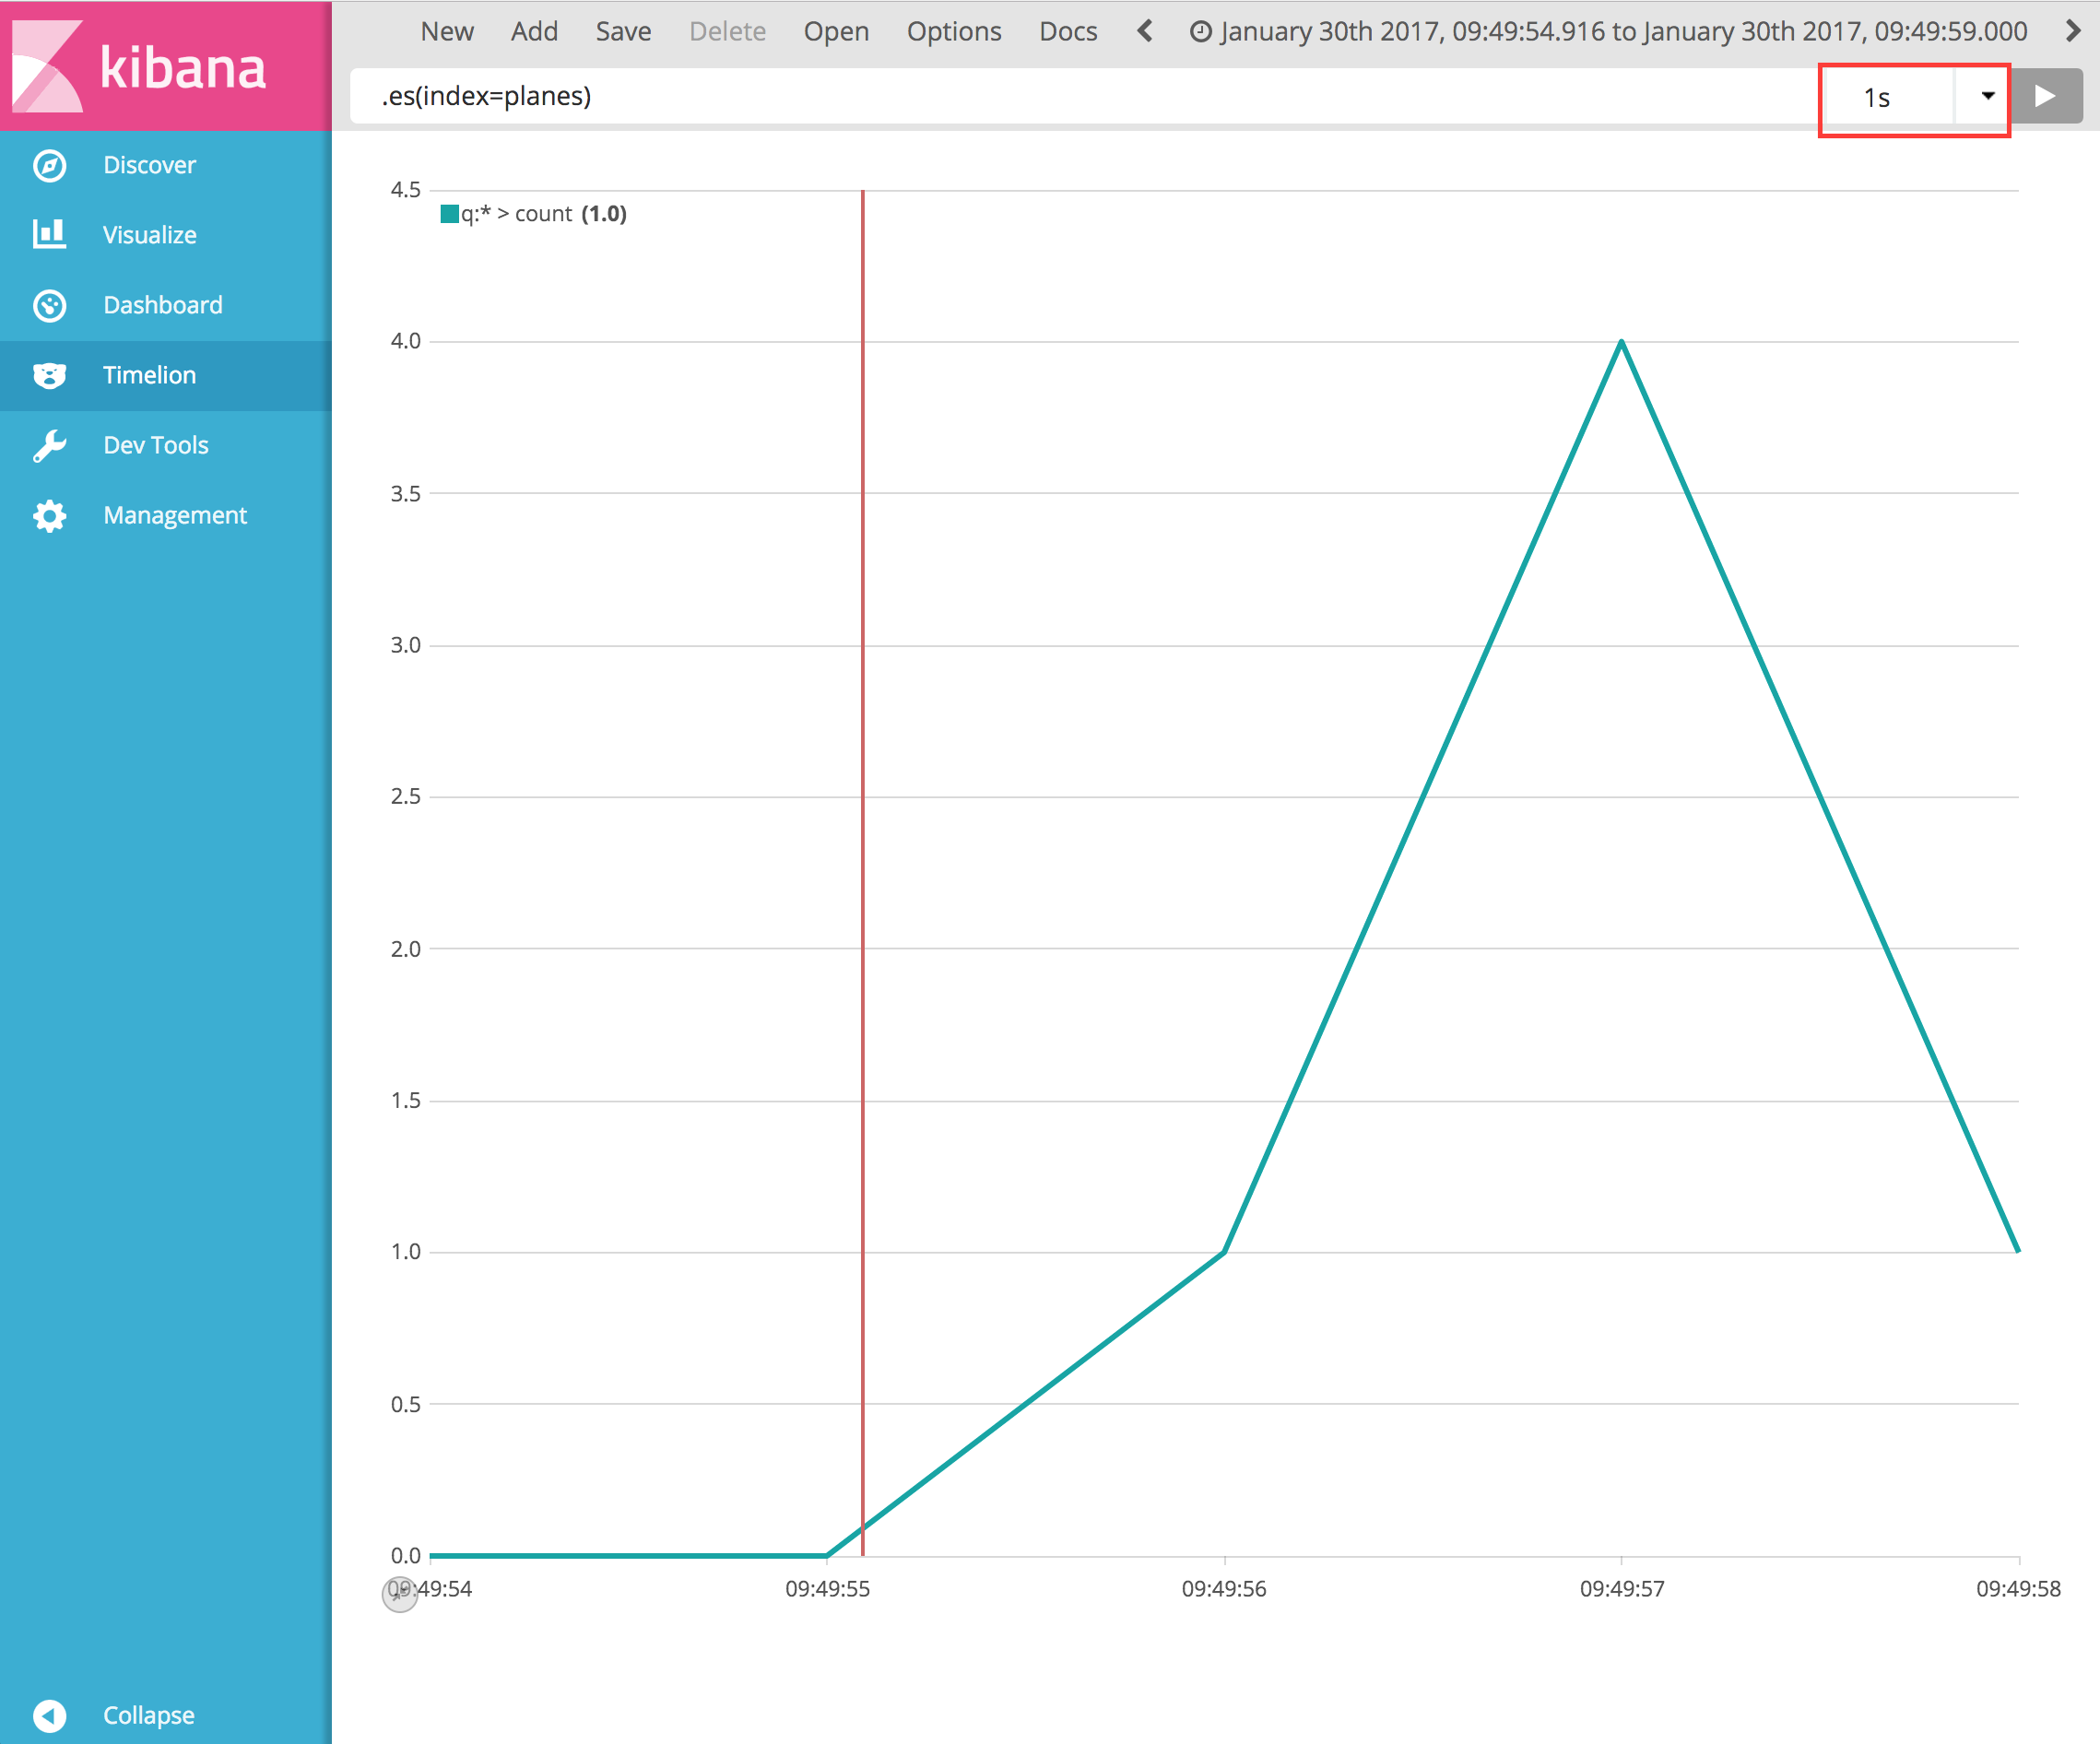
If you're wanting to perform the moving average on the individual data-points, I'm afraid this isn't going to give you your desired results. Additionally, the calculation that you're looking for doesn't appear to be a moving average.
Timelion is specifically for timeseries data, so unfortunately there isn't a way to change the x-axis to something else.
---
### Author:  [@system](https://discuss.elastic.co/u/system)
#### Post date: [April 13, 2017, 1:13pm UTC](https://discuss.elastic.co/t/timelion-help-for-plotting-calculated-movingaverage/78814/3 "2017-04-13T13:13:58Z")
This topic was automatically closed 28 days after the last reply. New replies are no longer allowed.