# Too many lines in Line Chart
**URL:** https://discuss.elastic.co/t/too-many-lines-in-line-chart/147726
**Category:** Kibana
**Created:** [September 7, 2018, 1:57pm UTC](https://discuss.elastic.co/t/too-many-lines-in-line-chart/147726 "2018-09-07T13:57:24Z")
**Posts on this page:** 4
**Page:** 1
### Author:  [@atom](https://discuss.elastic.co/u/atom)
#### Post date: [September 7, 2018, 1:57pm UTC](https://discuss.elastic.co/t/too-many-lines-in-line-chart/147726/1 "2018-09-07T13:57:24Z")
Hi There,
i have crated a line chart visualization.
In this visualization i use date histogram for x axis and count of a value for y axis. The visualization is ok but i have too many different counts. Kibana is showing me too many lines in the chart. Is it possible to show only the top 5 counts?
---
### Author:  [@cjcenizal](https://discuss.elastic.co/u/cjcenizal)
#### Post date: [September 7, 2018, 8:04pm UTC](https://discuss.elastic.co/t/too-many-lines-in-line-chart/147726/2 "2018-09-07T20:04:17Z")
Hi there, for a date histogram you can change the "Interval" value for your bucket aggregation to change the number of buckets (bars). Here's how switching from an interval of "Minutes" to "Hours" reduces the number of bars in an example chart:

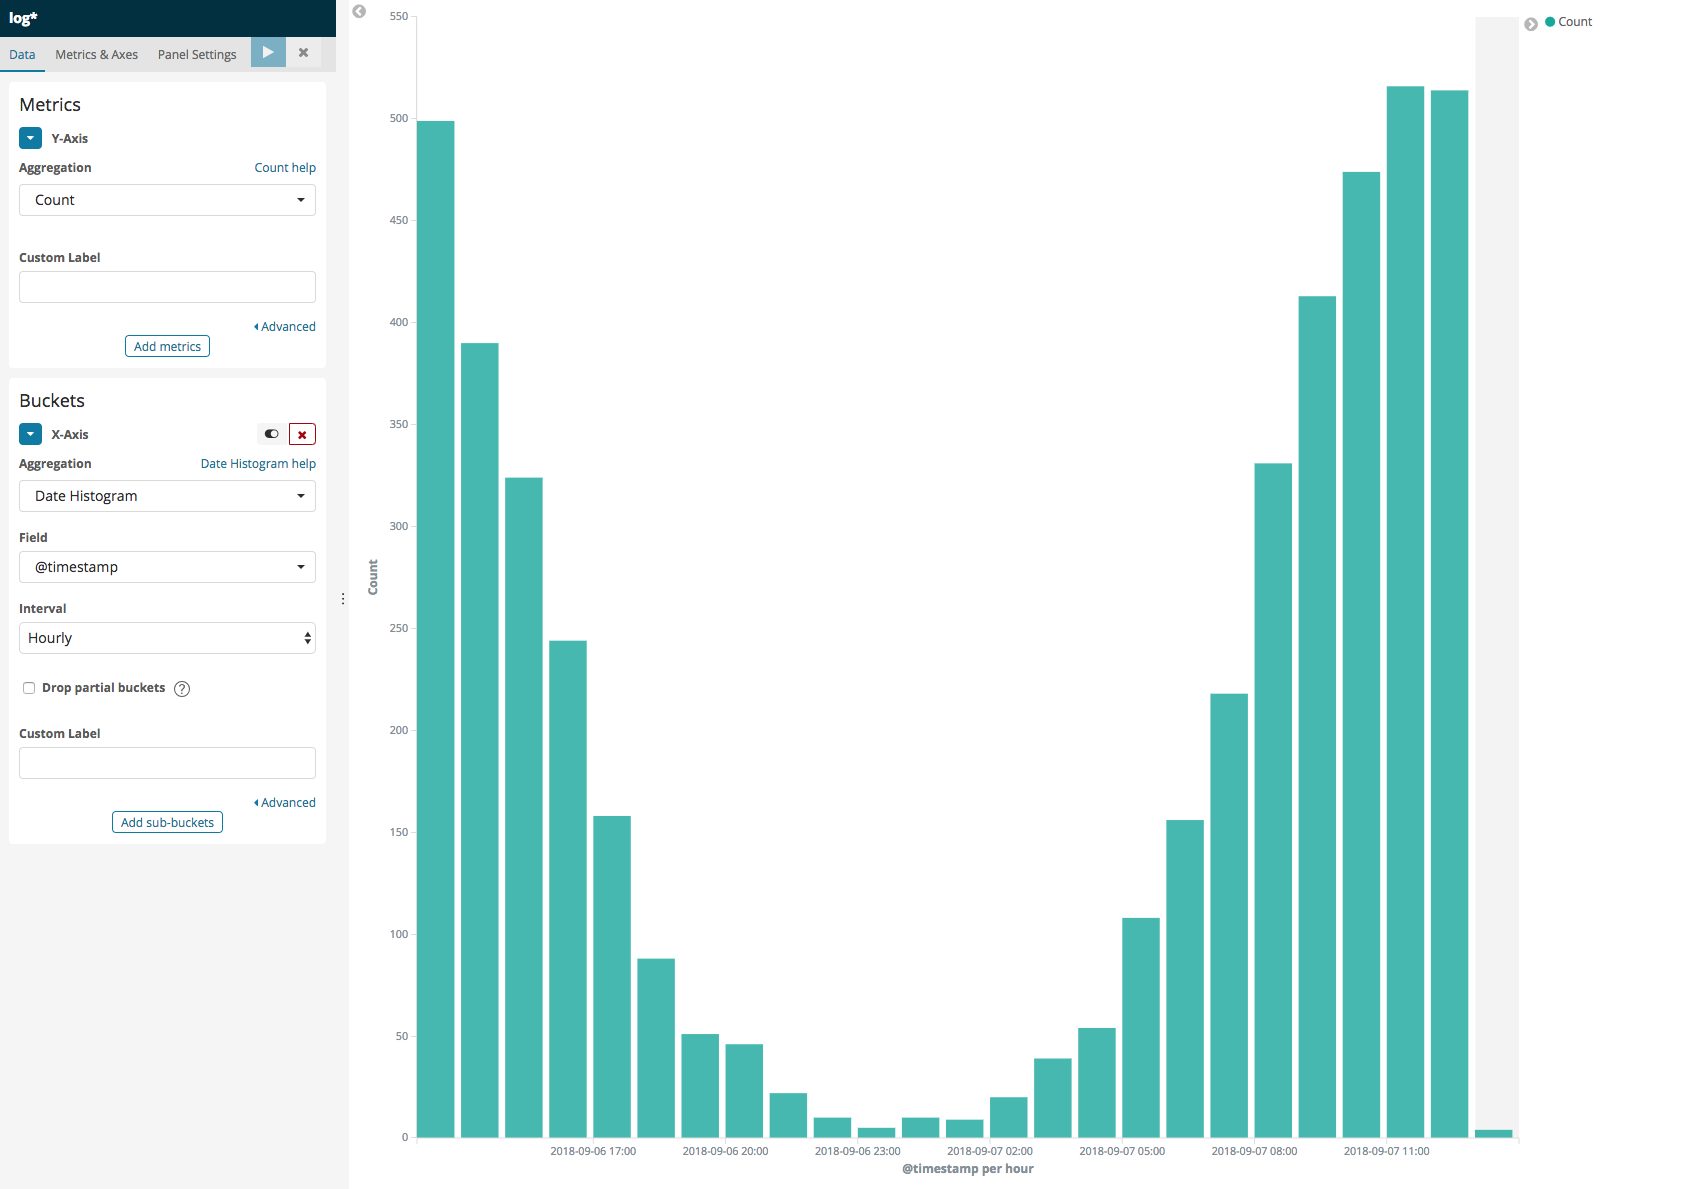
I can also choose a custom interval to more precisely define how many bars should show up. In this example, I've chosen a custom interval of `6h`. Dividing my 24 hour time period by this interval results in 5 bars.

Hope this helps,
CJ
---
### Author:  [@atom](https://discuss.elastic.co/u/atom)
#### Post date: [September 13, 2018, 9:31am UTC](https://discuss.elastic.co/t/too-many-lines-in-line-chart/147726/3 "2018-09-13T09:31:13Z")
Hi cj,
thank for your response.
I found another way of doing it. Maybe this will be a help if someone searches for it 🙂
I have craeted a timelion visualization and set a limit.
`.es(q='', split=hops.keyword:5, metric=avg:size)`
---
### Author:  [@system](https://discuss.elastic.co/u/system)
#### Post date: [October 11, 2018, 9:31am UTC](https://discuss.elastic.co/t/too-many-lines-in-line-chart/147726/4 "2018-10-11T09:31:14Z")
This topic was automatically closed 28 days after the last reply. New replies are no longer allowed.