# TSVB Table And Regular Table Vis Not Same
**URL:** https://discuss.elastic.co/t/tsvb-table-and-regular-table-vis-not-same/185447
**Category:** Kibana
**Created:** [June 12, 2019, 2:43pm UTC](https://discuss.elastic.co/t/tsvb-table-and-regular-table-vis-not-same/185447 "2019-06-12T14:43:35Z")
**Posts on this page:** 4
**Page:** 1
### Author:  [@wwalker](https://discuss.elastic.co/u/wwalker)
#### Post date: [June 12, 2019, 2:43pm UTC](https://discuss.elastic.co/t/tsvb-table-and-regular-table-vis-not-same/185447/1 "2019-06-12T14:43:35Z")
I have two tables, one that was created using the table visual in Kibana, the other is a Time Series Visual Builder table. They each are grouping by a URI field (The stuff after .com, .net, .org, etc...) and reporting two numbers. The first number is your basic count, how many times that URI appears for a given time, no problems there. The second number is where things get weird for me. The second number reports how many times that URI appears based on the cardinality (unique count) of another field, IP address. The intent here is to see how many unique visitors we have to any given URI. Unfortunately, over the same time period, TSVB reports a significantly higher cardinality count than the Kibana table. Is there a bug with something or have I just configured something wrong? TSVB table on the left, Kibana table on the right
 
---
### Author:  [@wwalker](https://discuss.elastic.co/u/wwalker)
#### Post date: [June 12, 2019, 2:44pm UTC](https://discuss.elastic.co/t/tsvb-table-and-regular-table-vis-not-same/185447/2 "2019-06-12T14:44:52Z")
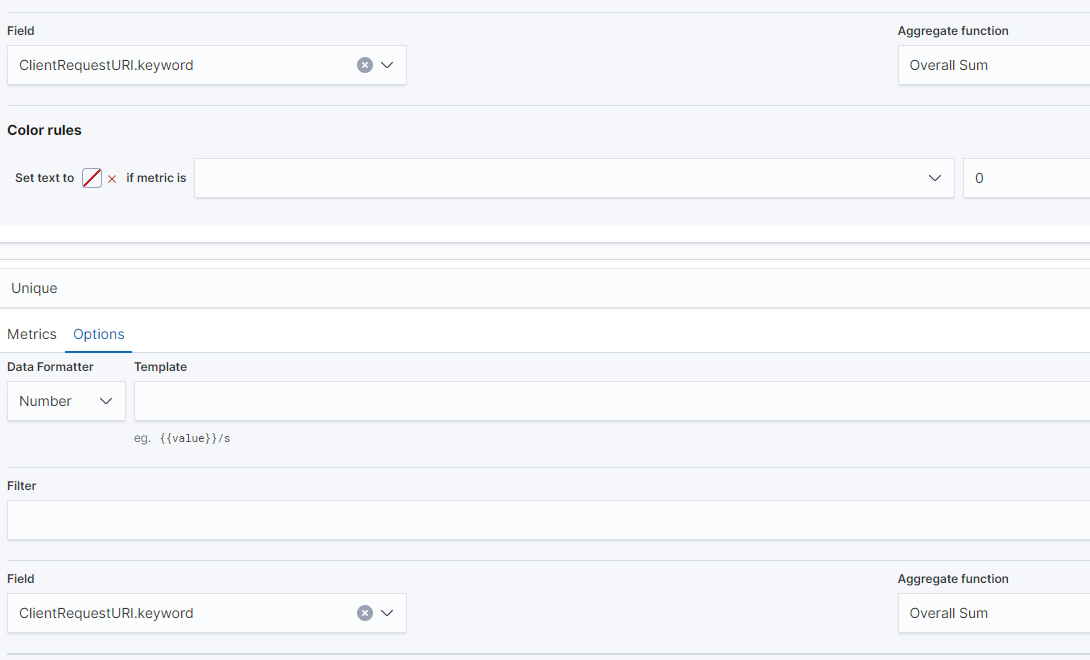
Guess I could include my filter configs...doh....
Kibana table:

TSVB table:

---
### Author:  [@wwalker](https://discuss.elastic.co/u/wwalker)
#### Post date: [June 13, 2019, 6:20pm UTC](https://discuss.elastic.co/t/tsvb-table-and-regular-table-vis-not-same/185447/3 "2019-06-13T18:20:20Z")
Anybody see this before?
---
### Author:  [@system](https://discuss.elastic.co/u/system)
#### Post date: [July 11, 2019, 6:20pm UTC](https://discuss.elastic.co/t/tsvb-table-and-regular-table-vis-not-same/185447/4 "2019-07-11T18:20:27Z")
This topic was automatically closed 28 days after the last reply. New replies are no longer allowed.